NZD/USD Elliott Wave technical analysis [Video]
![NZD/USD Elliott Wave technical analysis [Video]](https://editorial.fxstreet.com/images/Markets/Currencies/Majors/NZDUSD/new-zealand-dollar-61366114_XtraLarge.jpg)
NZD/USD Elliott Wave technical analysis
-
Function: Trend.
-
Mode: Impulsive.
-
Structure: Orange wave 1.
-
Position: Navy blue wave 3.
-
Next higher degrees direction: Orange wave 1 (initiated).
-
Details: Orange wave C of 2 appears completed; now, orange wave 1 of 3 is in progress.
-
Wave cancel invalid level: 0.58562.
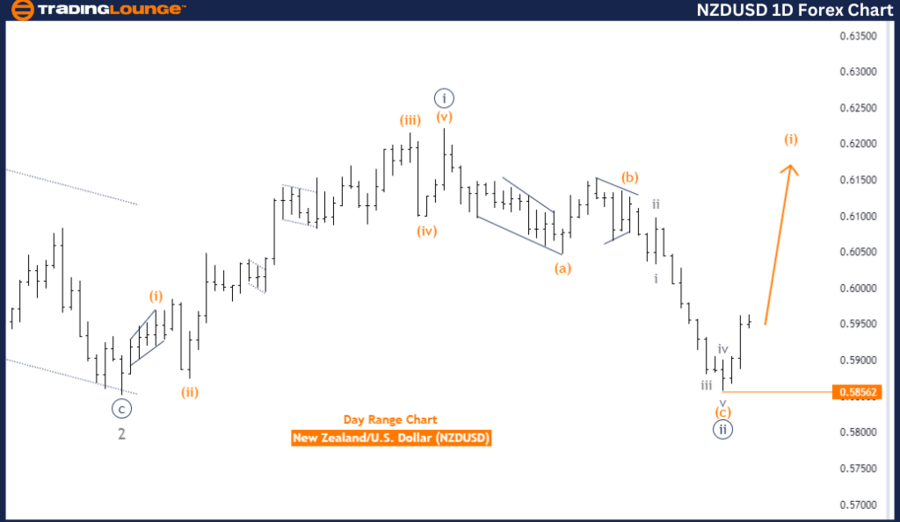
The Elliott Wave analysis for NZDUSD on the daily chart highlights a trend functioning in an impulsive mode. The current structure identifies orange wave 1 positioned within the larger navy blue wave 3, suggesting a significant upward movement in the market within a broader impulsive wave pattern.
Technical analysis indicates that orange wave C of 2 seems to have completed, marking the end of a corrective phase and the beginning of a new impulsive wave, specifically orange wave 1 of 3. This transition from corrective to impulsive phase suggests an upward momentum is currently underway.
The analysis for the next higher degrees points to orange wave 1, indicating the early stage of a larger impulsive wave. The market is expected to continue its upward trend as it moves through the subsequent waves of the impulsive sequence.
The wave cancel invalid level is set at 0.58562, which serves as a crucial threshold for the current wave analysis. If NZDUSD falls below this level, the current wave count would be invalidated, signaling that the expected wave pattern is no longer valid. This scenario would necessitate a reassessment of the wave count and the overall market outlook.
In summary, the NZDUSD Elliott Wave Analysis on the daily chart indicates the currency pair is in the early stages of a new impulsive upward trend within orange wave 1, positioned in navy blue wave 3. The completion of orange wave C of 2 signals the end of a corrective phase and the beginning of an impulsive phase, with orange wave 1 of 3 now active. The wave cancel invalid level of 0.58562 is a critical point for validating the current wave structure, and a breach of this level would require reevaluation of the wave count.
NZD/USD day chart
NZD/USD four-hour chart
-
Function: Trend.
-
Mode: Impulsive.
-
Structure: Gray wave 1.
-
Position: Orange wave 1.
-
Next lower degrees direction: Orange wave 2.
-
Details: Orange wave C of 2 appears completed; now gray wave 1 of 1 is in progress.
-
Wave cancel invalid level: 0.58562.
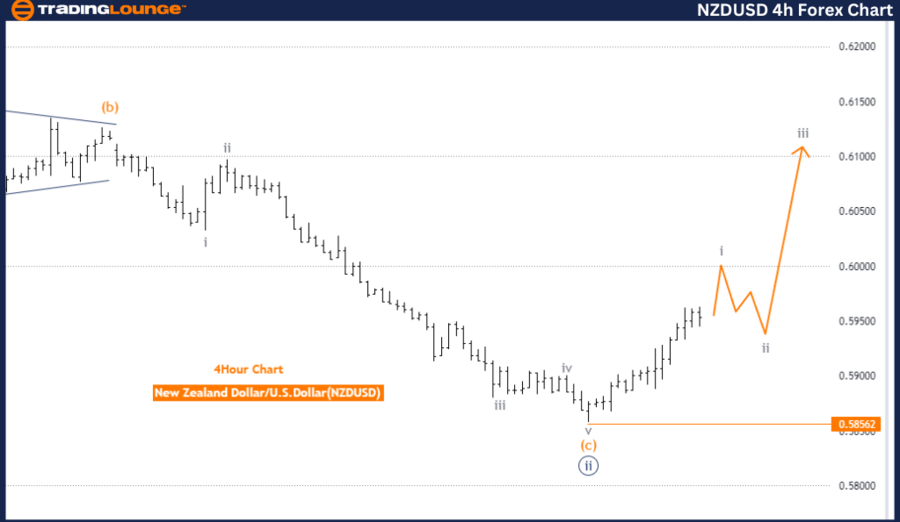
The Elliott Wave analysis for NZDUSD on the 4-hour chart indicates a trending function in an impulsive mode. The current structure identifies gray wave 1 positioned within orange wave 1, highlighting the start of a new upward trend with significant price movements.
According to the technical analysis, orange wave C of 2 seems to have completed, marking the end of the corrective phase represented by orange wave C. The market is now transitioning into gray wave 1 of 1, indicating the start of a new impulsive wave and suggesting potential upward momentum.
The direction for the next lower degrees is identified as orange wave 2. After the ongoing gray wave 1 concludes, a corrective phase marked by orange wave 2 is expected. This phase may involve a temporary pullback or consolidation before the market resumes its primary upward movement. The presence of orange wave 2 indicates possible short-term fluctuations before continuing the overall upward trend.
The wave cancel invalid level is set at 0.58562, serving as a critical threshold for the current wave analysis. If NZDUSD falls below this level, the current wave count would be invalidated, indicating that the expected wave pattern is no longer applicable. This scenario would require a reassessment of the wave count and overall market outlook.
In summary, the NZDUSD Elliott Wave Analysis on the 4-hour chart shows that the currency pair is in the early stages of a new impulsive upward trend within gray wave 1, positioned in orange wave 1. The analysis suggests that orange wave C of 2 has been completed, and gray wave 1 of 1 is now in play, with orange wave 2 expected to follow. The wave cancel invalid level of 0.58562 is a crucial point for validating the current wave structure and would require reassessment if breached.
NZD/USD Elliott Wave technical analysis [Video]
Author

Peter Mathers
TradingLounge
Peter Mathers started actively trading in 1982. He began his career at Hoei and Shoin, a Japanese futures trading company.


