NZD/USD Elliott Wave technical analysis [Video]
![NZD/USD Elliott Wave technical analysis [Video]](https://editorial.fxstreet.com/images/Markets/Currencies/Majors/NZDUSD/new-zealand-dollar-closeup-28405768_XtraLarge.jpg)
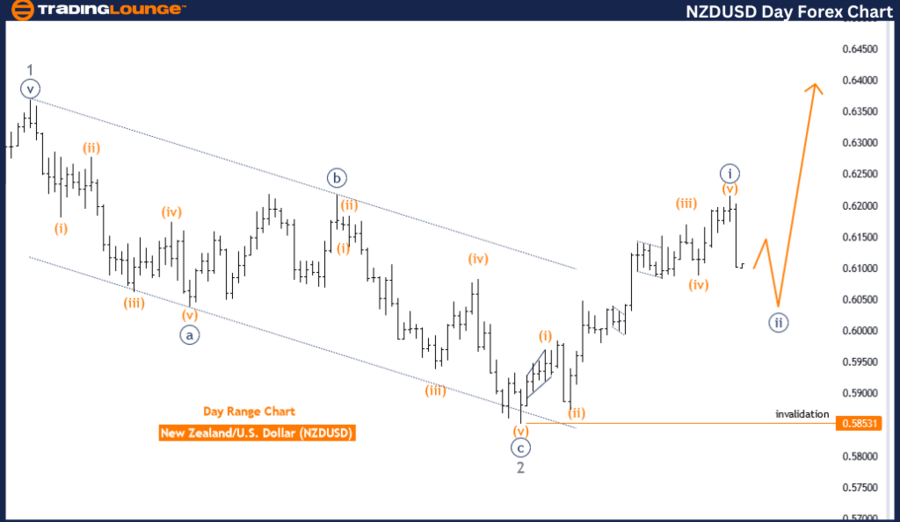
New Zealand Dollar/U.S.Dollar(NZDUSD) Day Chart
NZD/USD Elliott Wave technical analysis
Function: Trend.
Mode: Corrective.
Structure: Navy blue wave 2.
Position: Gray wave 3
Direction next higher degrees: Navy blue wave 3.
Details: Navy blue wave 1 looking completed at 0.62159, now navy blue wave 2 is in play.
Wave cancel invalid level: 0.58531.
The NZDUSD Elliott Wave analysis on the daily chart indicates a trending market within a corrective mode. This suggests that while the overall trend is continuing, the market is currently experiencing a corrective phase. The structure of this correction is identified as navy blue wave 2, positioned within gray wave 3, highlighting an intermediate corrective phase within a larger trend.
The analysis details that navy blue wave 1 has likely completed at the level of 0.62159. This completion marks the end of the initial impulsive wave within the broader trend, setting the stage for the corrective phase, which is currently identified as navy blue wave 2. The current phase, navy blue wave 2, indicates a pullback or retracement in the market following the completion of navy blue wave 1.
The direction for the next higher degrees points to the eventual continuation of navy blue wave 3 after the completion of the current corrective phase. This suggests that once navy blue wave 2 concludes, the market is expected to resume its trend direction in the form of navy blue wave 3, which typically represents a strong impulsive move in the direction of the primary trend.
A critical aspect of this analysis is the wave cancel invalid level, set at 0.58531. This level serves as a benchmark for validating the current wave count. If the market price falls below this level, it would invalidate the existing wave structure, necessitating a reevaluation of the wave analysis and potentially altering the expected market direction.
In summary, the NZDUSD daily chart analysis highlights a trending market within a corrective phase, identified as navy blue wave 2 within gray wave 3. The completion of navy blue wave 1 at 0.62159 has led to the current corrective phase of navy blue wave 2. The wave cancel invalid level at 0.58531 is crucial for maintaining the accuracy of the current wave count. This analysis provides a comprehensive understanding of the current corrective phase, assisting traders in anticipating potential market moves and making informed trading decisions based on the expected continuation of the trend.
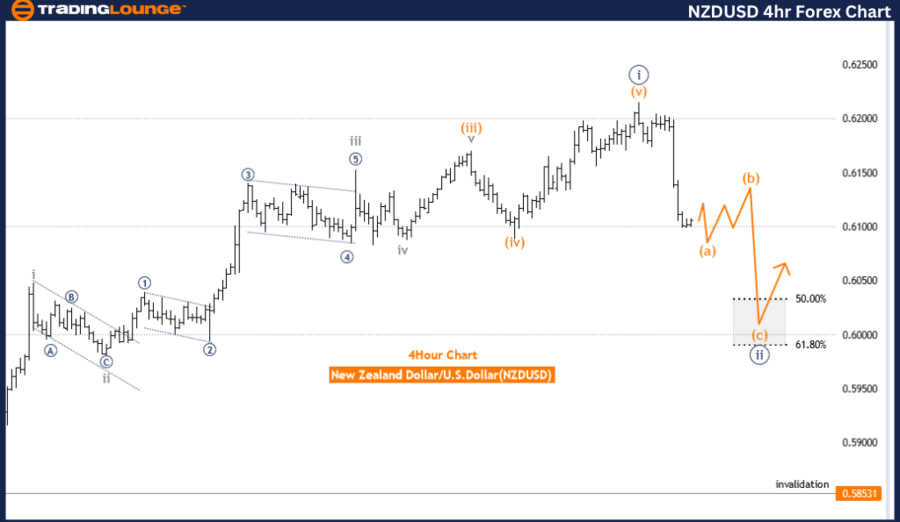
NZD/USD Elliott Wave technical analysis four-hour chart
Function: Counter Trend.
Mode: Corrective.
Structure: Orange wave A.
Position: Navy blue wave 2.
Direction next higher degrees: Orange wave B.
Details: Orange wave A of 2 still is in play and looking near to end.
Wave cancel invalid level: 0.58531.
The NZDUSD Elliott Wave analysis on the 4-hour chart identifies a counter trend movement, indicating a temporary deviation from the main trend. The mode of this movement is corrective, which suggests the current price action is adjusting before potentially resuming the primary trend. The structure is identified as orange wave A, positioned within navy blue wave 2, highlighting a corrective phase within the broader wave cycle.
The analysis points out that orange wave A of 2 is still in play and appears to be nearing its completion. This phase typically represents the initial leg of a corrective wave, where the market undergoes a retracement or pullback. The completion of orange wave A will likely lead to the commencement of orange wave B, which generally involves a move in the opposite direction of wave A as part of the corrective pattern.
The direction for the next higher degrees indicates that orange wave B is expected to follow. This suggests that after the completion of orange wave A, the market might experience a rebound or counter move in the form of orange wave B, contributing to the overall corrective structure.
A critical aspect of this analysis is the wave cancel invalid level, set at 0.58531. This level acts as a benchmark for validating the current wave count. If the market price drops below this level, it would invalidate the existing wave structure, necessitating a reevaluation of the wave analysis and potentially altering the expected market direction.
In summary, the NZDUSD 4-hour chart analysis reveals a counter trend movement in a corrective mode, with the current structure identified as orange wave A within navy blue wave 2. Orange wave A appears to be nearing its end, setting the stage for orange wave B. The wave cancel invalid level at 0.58531 is crucial for maintaining the accuracy of the current wave count. This analysis provides a detailed understanding of the corrective phase, assisting traders in anticipating potential market reversals and making informed trading decisions based on the expected continuation of the wave pattern.
NZD/USD Elliott Wave technical analysis [Video]
Author

Peter Mathers
TradingLounge
Peter Mathers started actively trading in 1982. He began his career at Hoei and Shoin, a Japanese futures trading company.


