NZD/USD bears target deeper correction amid US Dollar strength

In the daily time frame, NZD/USD has entered a corrective phase following a significant uptrend that began in mid-July. After climbing steadily, the pair is now showing signs of weakness, as sellers attempt to capitalize on the recent reversal. The pair remains comfortably above its weighted moving average (WMA), but the emerging downside momentum suggests a potential deeper correction.
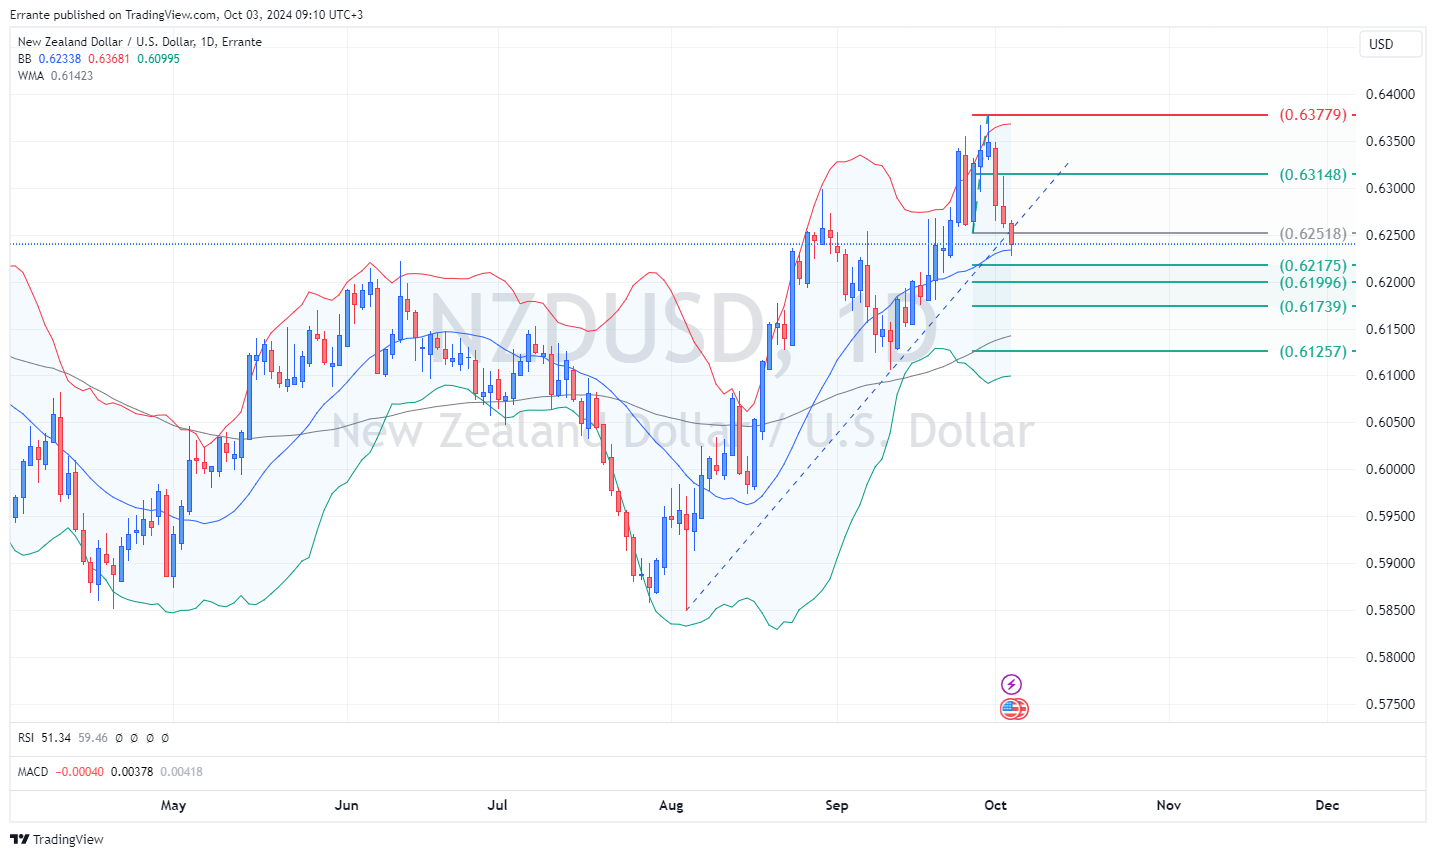
The Bollinger Bands are narrowing, indicating reduced volatility, and price action is approaching the middle band, suggesting a temporary loss of bullish momentum. A sustained move below the middle band could signal the beginning of a larger retracement.
Momentum indicators confirm this bearish outlook. The Relative Strength Index (RSI) has dropped to 51.34, highlighting a shift from bullish conditions to more neutral territory. A continued decline in the RSI could indicate growing selling pressure. Furthermore, the MACD has recently turned negative, with its lines converging, signaling the possibility of extended downside in the coming sessions.
Key Fibonacci retracement levels provide insight into potential support areas. The first significant support lies at 0.62175, and a break below this level could accelerate the downside, targeting 0.61996 and 0.61739. These levels represent key areas of interest for sellers and may act as obstacles to any further decline. Should the bearish momentum persist, the pair could eventually test deeper support at 0.61257.
However, a reversal could still be in the cards if buyers manage to defend these support levels and regain control of the market.
Alternative scenario
On the flip side, if NZD/USD buyers regain momentum, the pair could rise toward key resistance at 0.62518. A break above this level could challenge the next upside targets at 0.63148 and 0.63779. A decisive move above 0.63779 would invalidate the current bearish scenario and signal a potential resumption of the broader uptrend.
Technical indicators summary
RSI: Approaching neutral, but leaning bearish as it drops from overbought levels.
MACD: Bearish, with signals of extended downside.
Bollinger Bands: Narrowing, indicating reduced volatility and potential for further correction.
Key levels overview
Resistance levels:
-
Resistance 1: 0.62518.
-
Resistance 2: 0.63148.
-
Resistance 3: 0.63779.
Current price: 0.62400.
Support levels:
-
Support 1: 0.62175.
-
Support 2: 0.61996.
-
Support 3: 0.61739.
-
Support 4: 0.61257.
Key events to watch
Several economic reports are scheduled for Thursday that could influence NZD/USD. In the US, the focus will be on the weekly jobless claims and the ISM non-manufacturing PMI, which are expected to provide further insights into the strength of the US economy. A strong labor market report could solidify the US dollar's position and apply additional pressure on the New Zealand dollar.
Conversely, if market sentiment shifts toward risk-on behavior, the New Zealand dollar could benefit from improved risk appetite, reversing some of the recent losses. However, as long as the US economic data continues to surprise on the upside, NZD/USD may struggle to regain bullish momentum.
Author

Ali Mortazavi
Errante
BEc, CMSA, Member of IFTA - International Federation of Technical Analysis, Associate Member of STA - Society of Technical Analysis (UK).


