NYSE Arca Oil index: The current overview

Fresh highs, resistance lines, and similarities. What are the implications?
Bulls push XOI to new highs
In yesterday’s article I shared with you my ideas for scenarios regarding oil movements. But what has happened recently with oil stocks? What movements can we expect in the case of the XOI in the near future? The answers to these questions appeared in yesterday's Oil Trading Alert. Today, I also share them with you. Have a nice read.
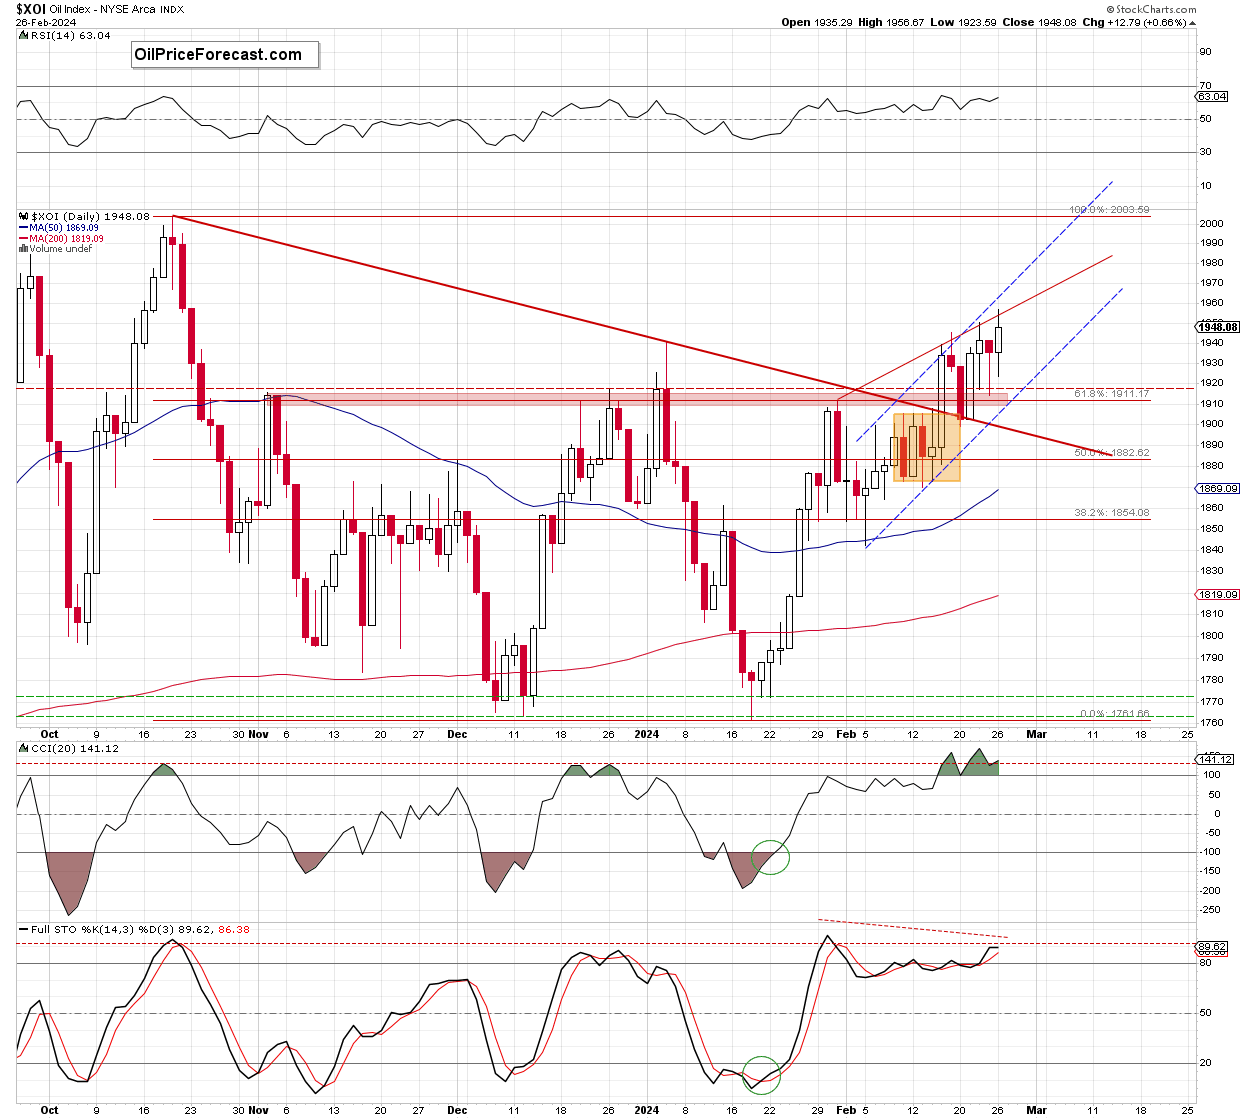
The first thing that catches the eye on the daily chart is the breakout above the red declining resistance line based on the previous peaks, which is a bullish development.
This show of the bulls’ strength encouraged the buyers to fight for higher values of XOI, which resulted not only in the breakout above the Jan.31 peak, but also in a test of the Jan.4 high on the same session.
Thanks to this price action, a big white candle appeared on the chart on Feb.15. On the following day, the buyers hit a fresh 2024 high (breaking above the Jan.4 peak), but as you can see, they didn’t manage to hold gained levels as the combination of resistance lines (the red resistance line based on the previous peaks and the upper border of the very short-term blue rising trend channel [marked with dashed lines]) stopped them, triggering a pullback.
As a result, the index corrected the earlier increase and slipped to the previously broken important resistance area created by the above-mentioned red resistance line (based on Oct.19, 2023 and Jan.2, 2024 highs) and the upper border of the orange consolidation.
Despite this drop, the bulls closed ranks and bounced off this area, creating another big white candle on the chart on Feb.21. Thanks to this price action, the XOI verified the earlier breakout above the mentioned resistance area, which translated into further improvement and fresh 2024 peans in the following days.
What's next for XOI?
Although this is a bullish development, we clearly see on the chart that the combination of the mentioned resistance lines continues to keep gains in check (especially the red resistance line based on Jan.31 and Feb. 15 peaks), which suggests that as long as they remain in the cards, another attempt to move lower in the very near future can’t be ruled out - especially when we take into account the fact that the XOI failed to successfully break above the red line during yesterday’s session.
At this point, it is worth noting that similar price action, we saw on Feb. 16 and Feb.22, which increases the probability that the history will likely repeat itself once again.
If this is the case and the XOI moves lower form here, the first target for the sellers would likely be the previously broken red area (based on the previous peaks), which was strong enough to stop the bears and trigger a rebound on Feb. 23 (a prolonged lower shadow of the candle confirms the bulls’ activity in this area).
At this point, it is also worth noting that this area is currently also supported by the lower border of the blue rising trend channel.
Therefore, as long as it remains in play, a bigger downswing is not likely.
Nevertheless, the current position of the daily indicators (the CCI and the Stochastic Oscillator remain in their overbought areas and there are also negative divergences between the indicators and the XOI) suggests that a bigger correction may be just around the corner.
However, as I mentioned before, in my opinion, a bigger slide will be more likely if the bears manage to break below the lower line of the blue channel, invalidating the very short-term upward trend.
Summing up, the XOI hit a fresh 2024 peak during yesterday’s session, which is a bullish development. However, the red resistance line continues to keep gains in check, which in combination with the current situation in the daily indicators suggests that the space for gains may be limited and lower values of the index may be just around the corner.
Want free follow-ups to the above article and details not available to 99%+ investors? Sign up to our free newsletter today!
Want free follow-ups to the above article and details not available to 99%+ investors? Sign up to our free newsletter today!
Author

Anna Radomska
Sunshine Profits
Anna's passion for drawing evolved into a fascination with colorful lines and shapes, which later inspired her interest in the stock market.


