Number of US Job Openings Falling Dramatically

The number of Job Openings is down since the beginning of the year. Hires are up
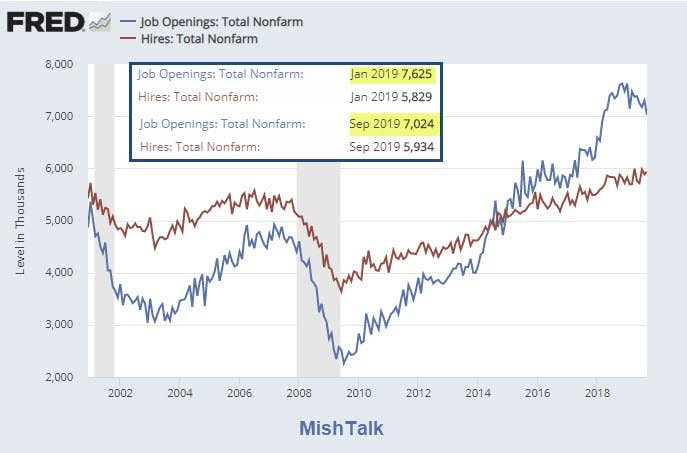
The BLS released its report on Job Openings and Labor Turnover (JOLTs) for September on November 5. The release is for the nonfarm sector.
The above chart shows hires vs openings.
Three Key Points
- Since January, openings are down from 7.625 million to 7.024 million, a net of -601,000 total.
- Since January, openings are down 7.88%
- Since January, hires are up from 5.829 million to 5.934 million per month.
- Over the 12 months ending in September, hires totaled 69.9 million and separations totaled 67.4 million, yielding a net employment gain of 2.5 million.
Point number 4 is from the JOLTs report.
All Nonfarm Employees
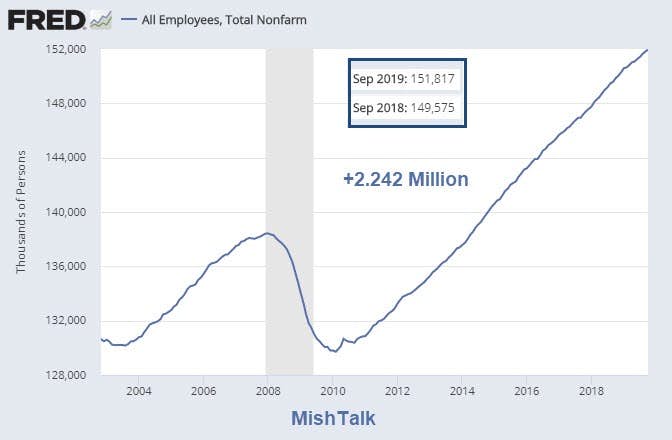
Employment Level

BLS Benchmark Revisions
Wait a second. What about Benchmark Revisions?
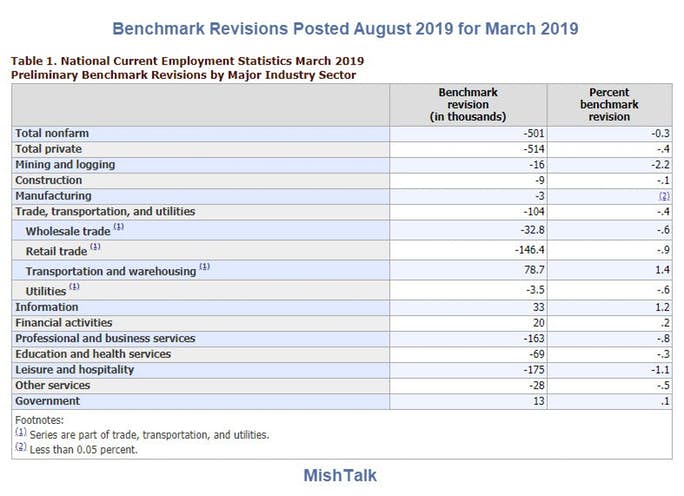
"Preliminary benchmark revisions are calculated only for the month of March 2019 for the major industry sectors in table 1. The existing employment series are not updated with the release of the preliminary benchmark estimate. The data for all CES series will be updated when the final benchmark revision is issued."
The final benchmark revision is not yet posted so 501,000 jobs are not reflected in the previous charts.
Nonetheless, this is clearly close enough for government work.
What Does This Mean?
The base numbers are off by 501,000 assuming the benchmark revision is accurate. The discrepancy between JOLTs and jobs is another 258,000.
Expect still more revisions, especially towards the top of economic cycles.
With more revisions coming, the question "What does this mean?" is best answered by this reply:
We cannot possibly know, because we don't even know what the numbers really are.
I especially am wary of alleged job openings, confident that they are boosted by tactical methods to secure more h1b visas.
However, due to Soaring Unit Labor Costs and Declining Productivity, it makes sense for the number of opening to decline, even if we don't know from what level.
Also note that the Decline in Profit Margins and Investment Suggests Recession Due Now.
This too supports a decline in openings.
If you have additional ideas, please comment.
Author

Mike “Mish” Shedlock's
Sitka Pacific Capital Management,Llc


