Not about liberation day

S2N spotlight
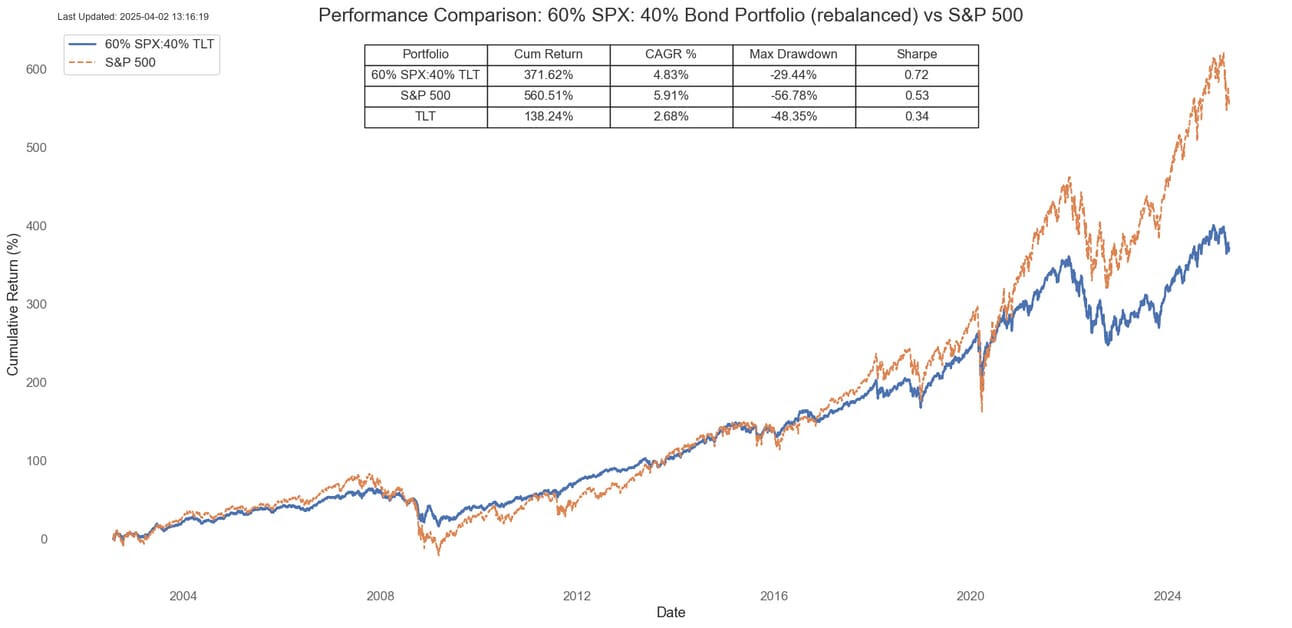
Everywhere I turn I seem to be reading about 60:40 portfolios. I have written about them many times before. I want to share its current performance and an exciting new feature I am in the process of adding to the research portal.
This chart goes back 23 years; it would produce a similar picture if I went back 53 years.
In essence, a 60:40 portfolio is more defensive than a pure equity play. It underperforms in dollar terms but outperforms on a risk-adjusted basis.
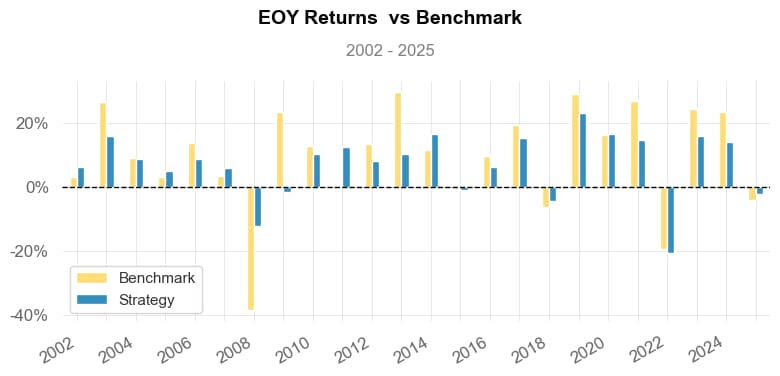
The next chart shows the annual returns of the 60:40 strategy vs the S&P 500 benchmark.
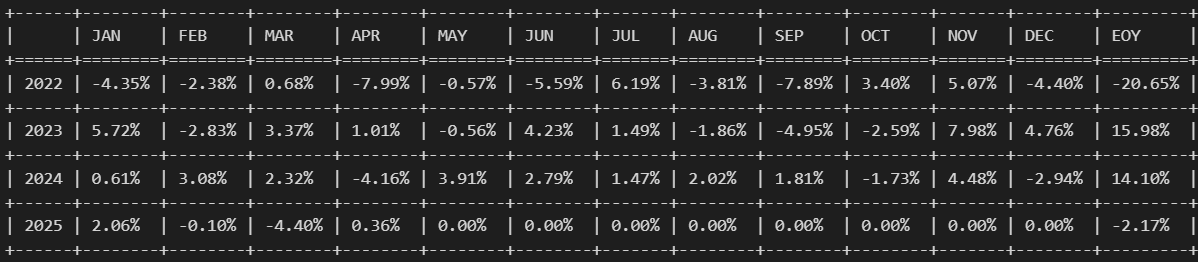
The table below shows the raw monthly performance numbers for a 60:40 strategy if this is something of interest.
Stanley Fink, the CEO of BlackRock, the world’s largest money manager, wrote in his annual letter to investors this week that he thinks the 60:40 portfolio era might be over. “The future standard portfolio may look more like 50/30/20 — stocks, bonds, and private assets like real estate, infrastructure, and private credit,” he said.
If you are cynical like me, you will straight away think his motivation is more fees. Having said that, I think there is merit in such a portfolio. What I am going to be doing is updating a whole bunch of strategies daily on the research portal. This way you will be able to visit the site any time of the day or night and look at the different strategies that are performing. This will be more than just 60:40 and All Weather and the classic portfolio optimisation strategies, but it will include more active strategies. Stay tuned. I have coded all the strategies; I just need to find the time to make sure they update correctly and look pretty.
S2N observations
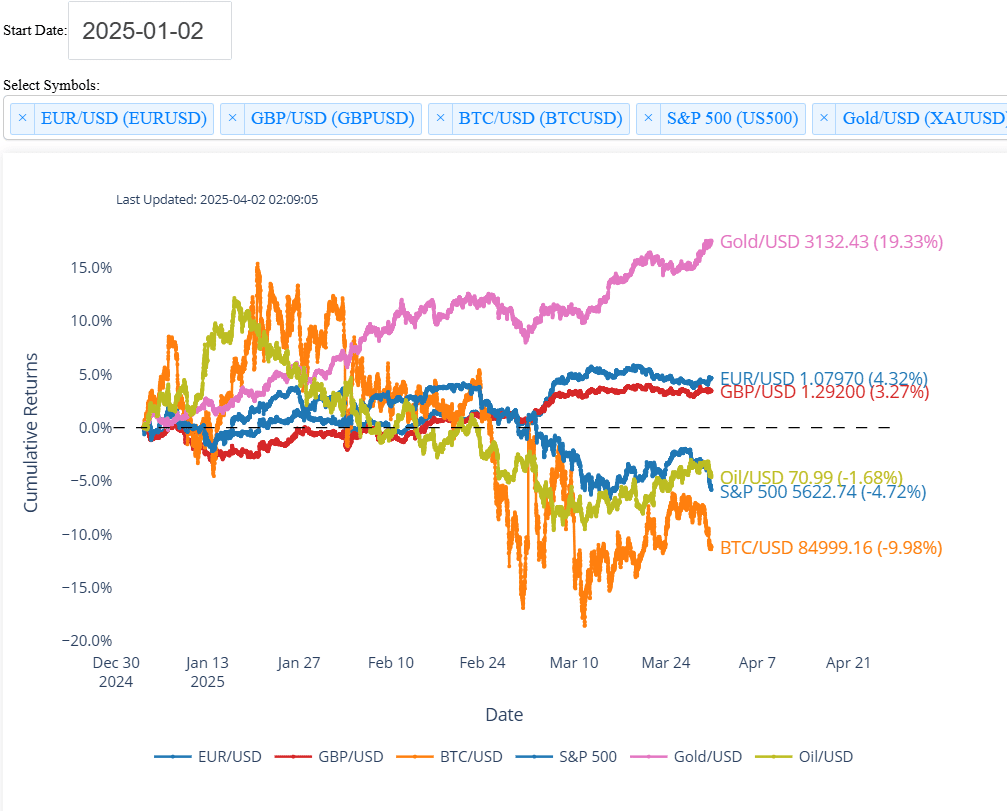
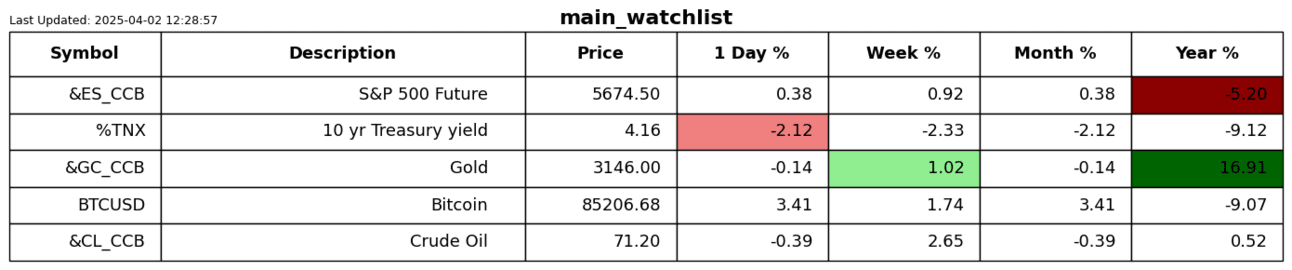
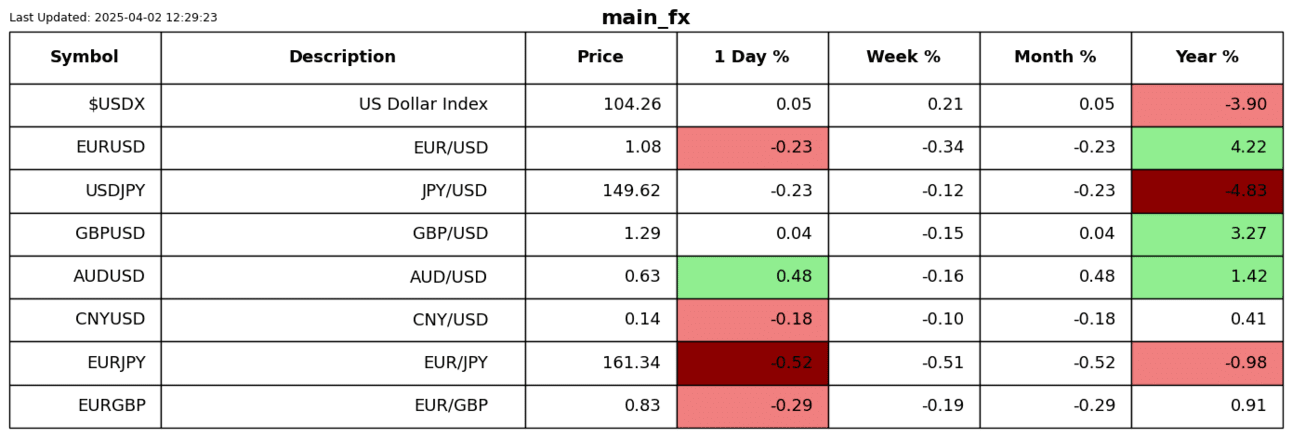
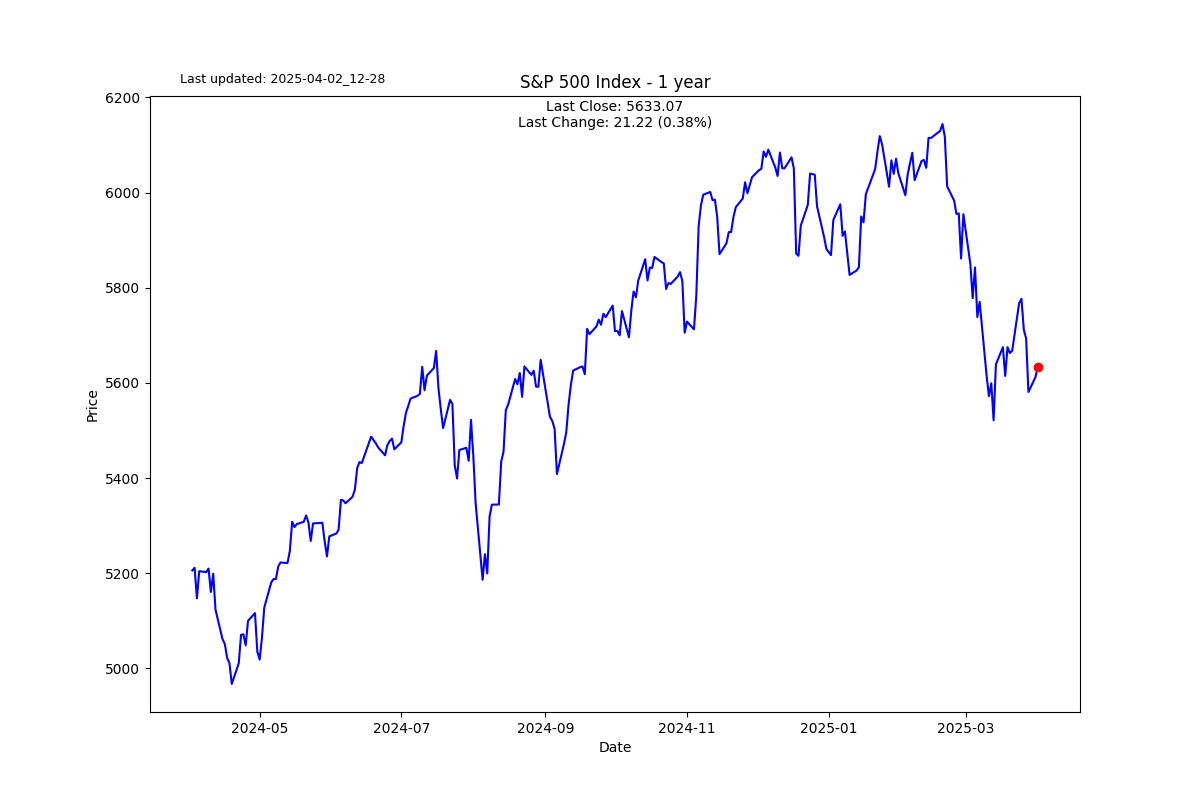
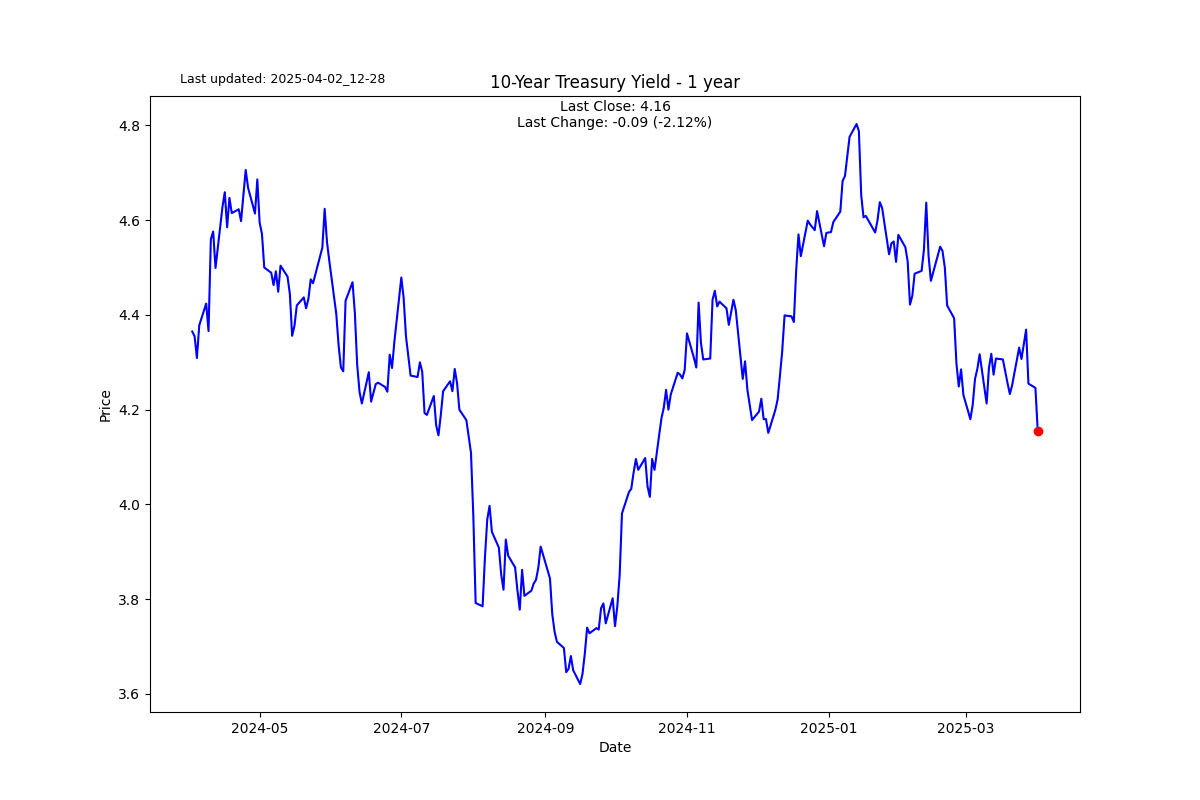
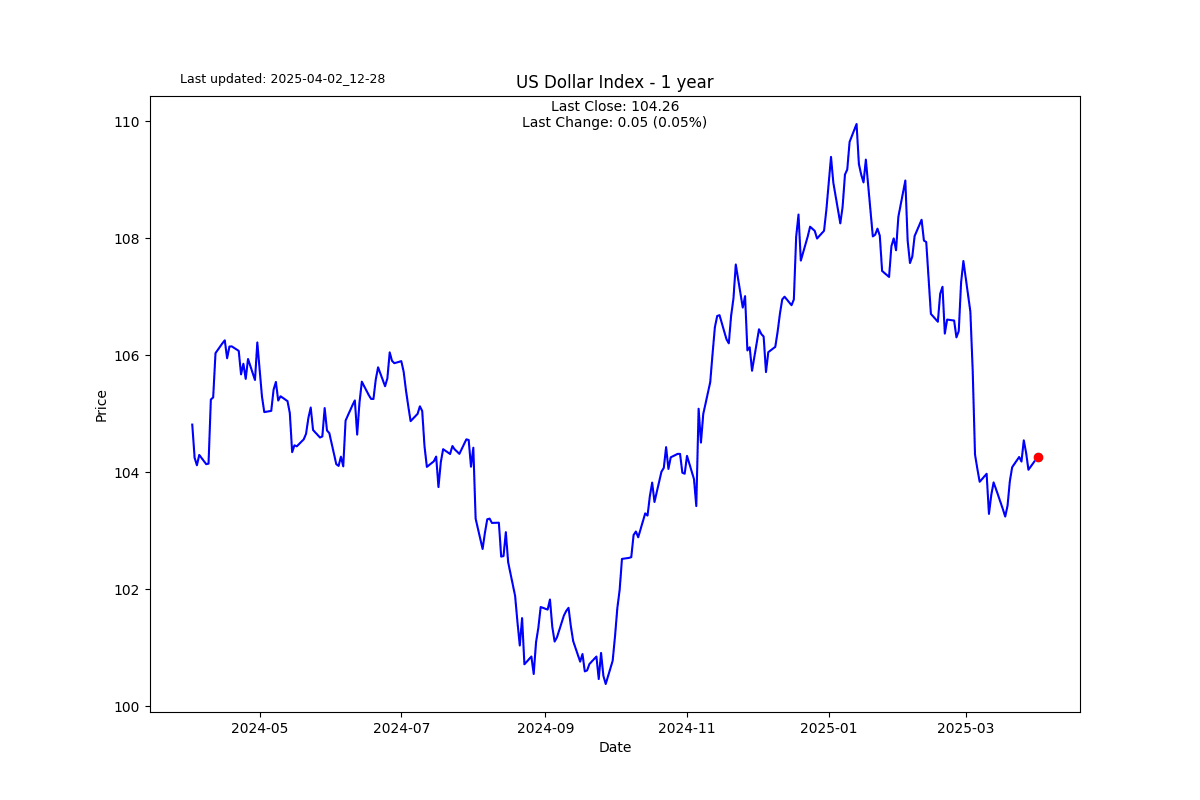
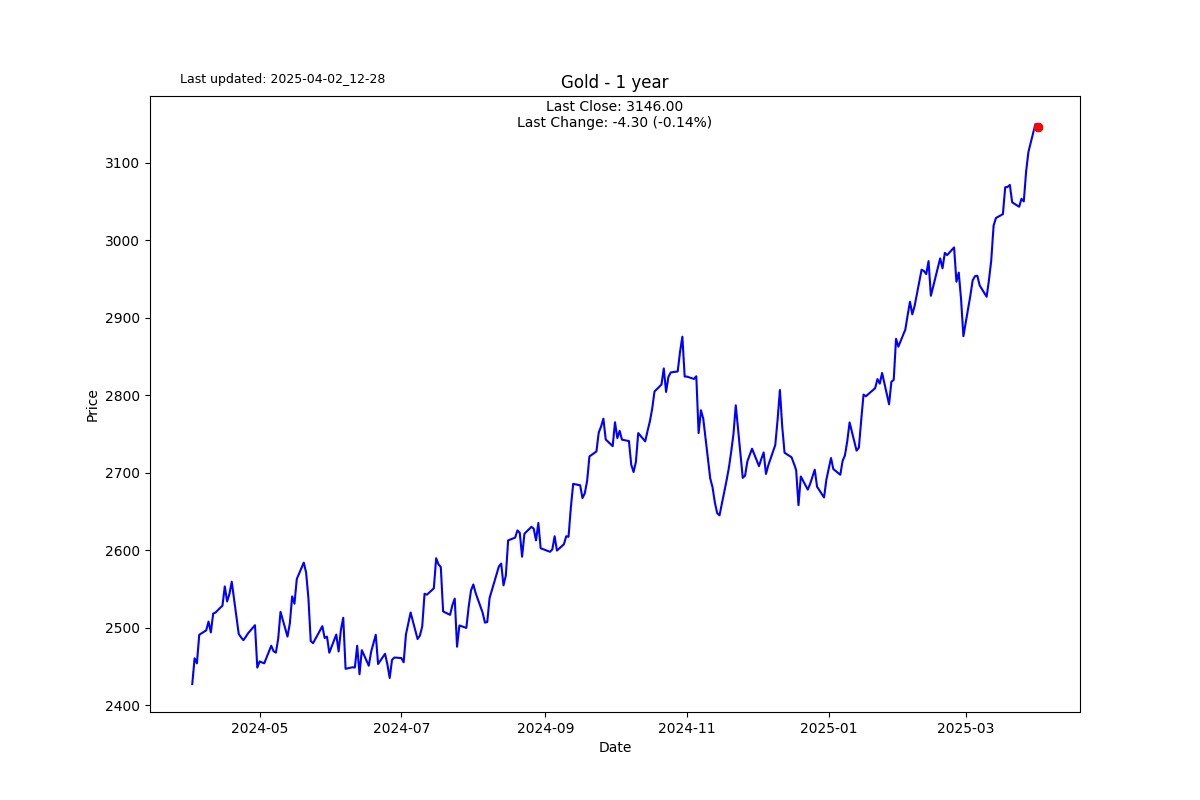
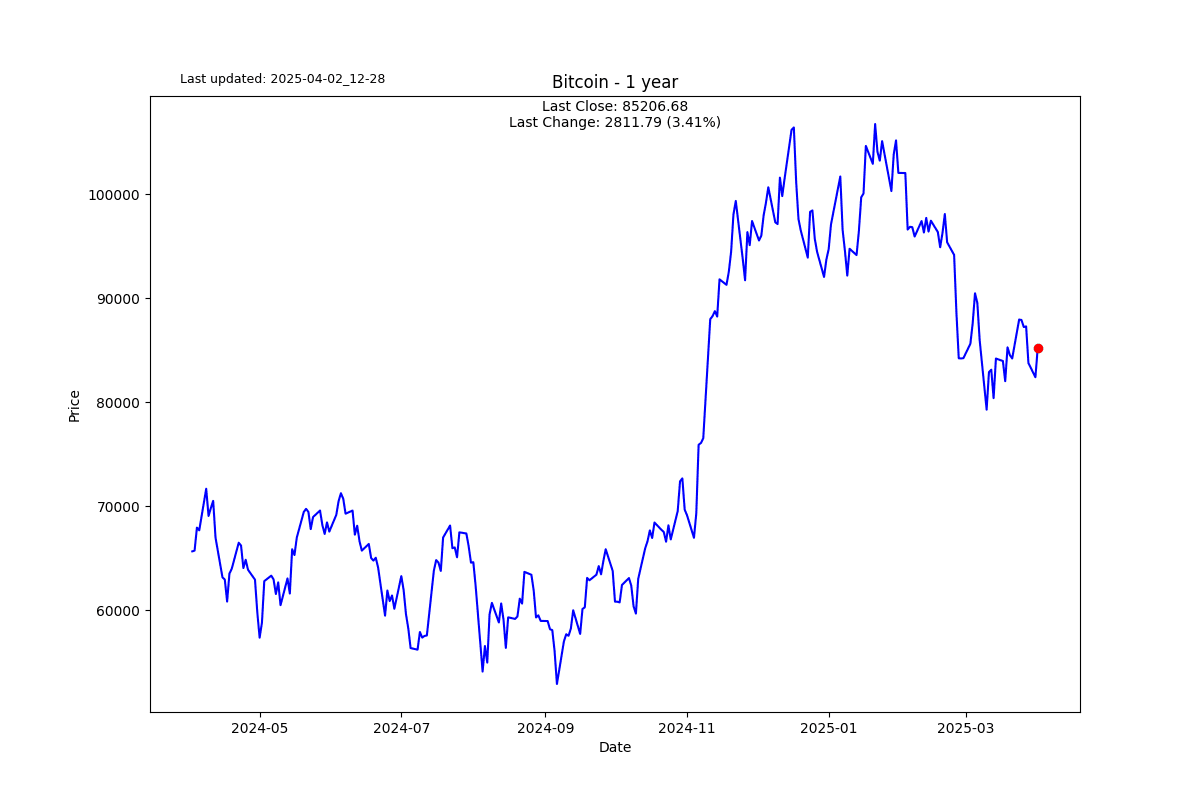
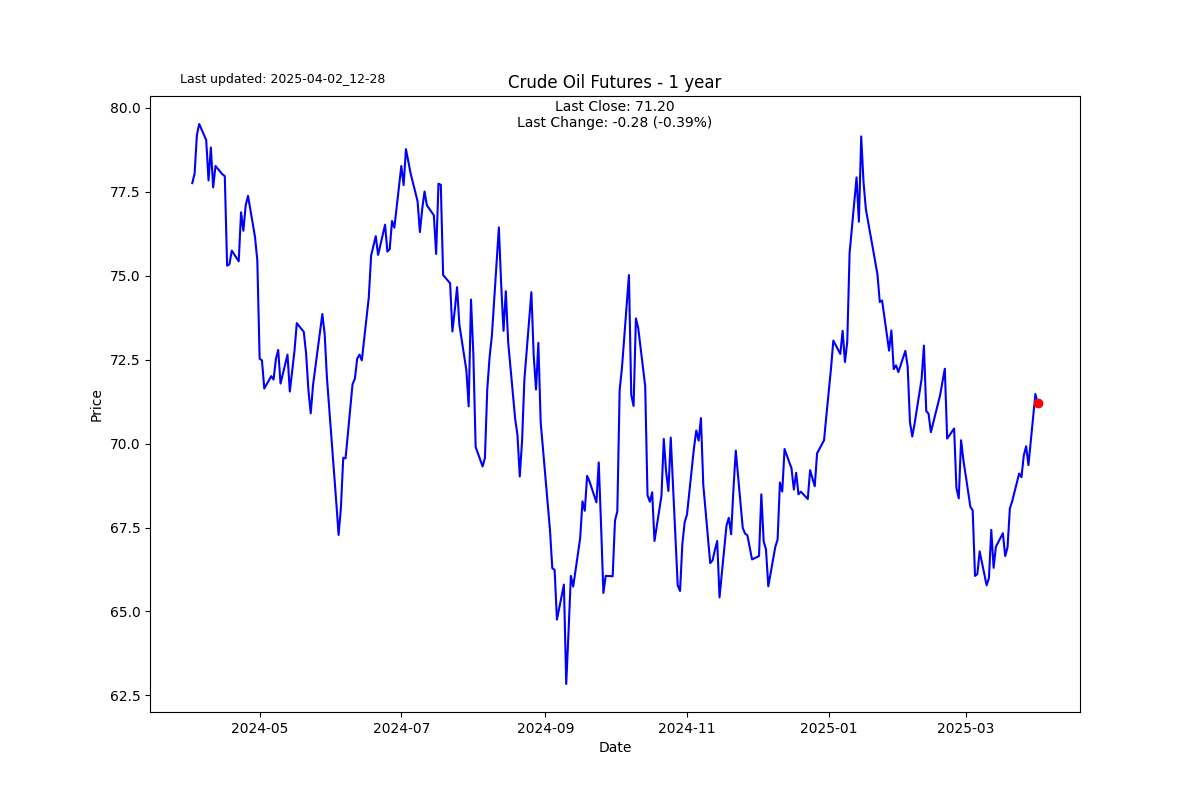
Speaking of the research portal. Here is one of my real-time visualisations. It is the price journey of some of the major assets we are all following year-to-date.
As we just completed Q1, it is useful to sit back and look at how the year has unfolded through time.
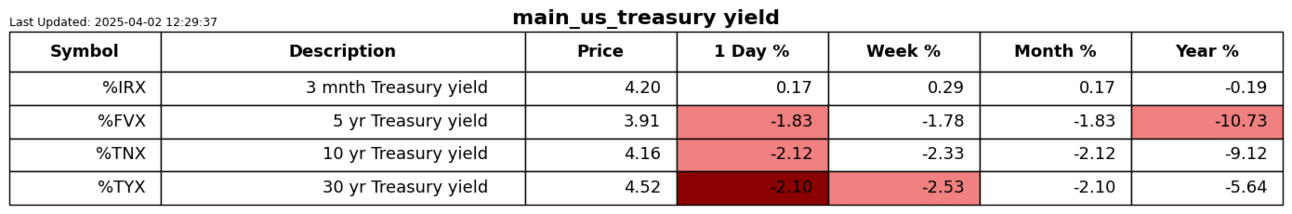
I have been speaking a lot about the pressure that is coming to the bond market. I am in the mood to see things in perspective with a wide lens. Do I really need to explain this chart? I don’t think so.
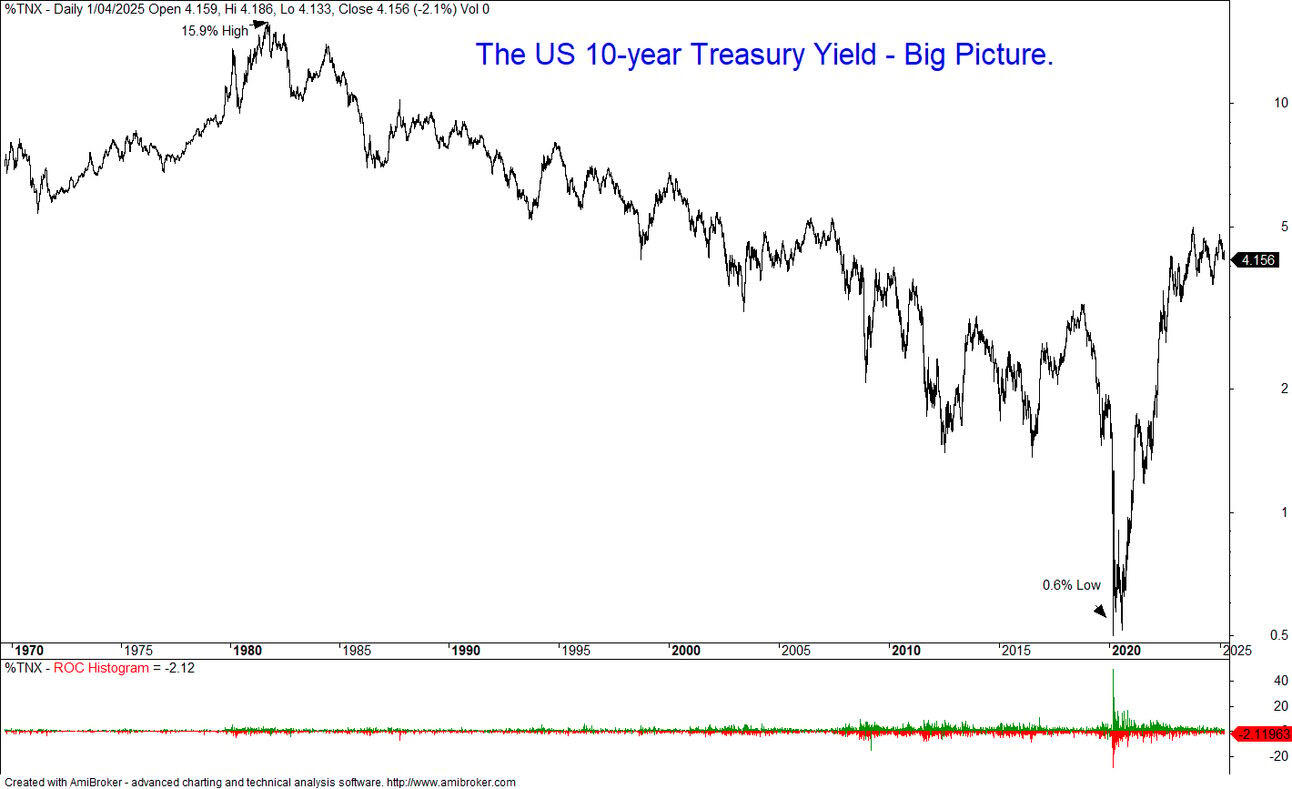
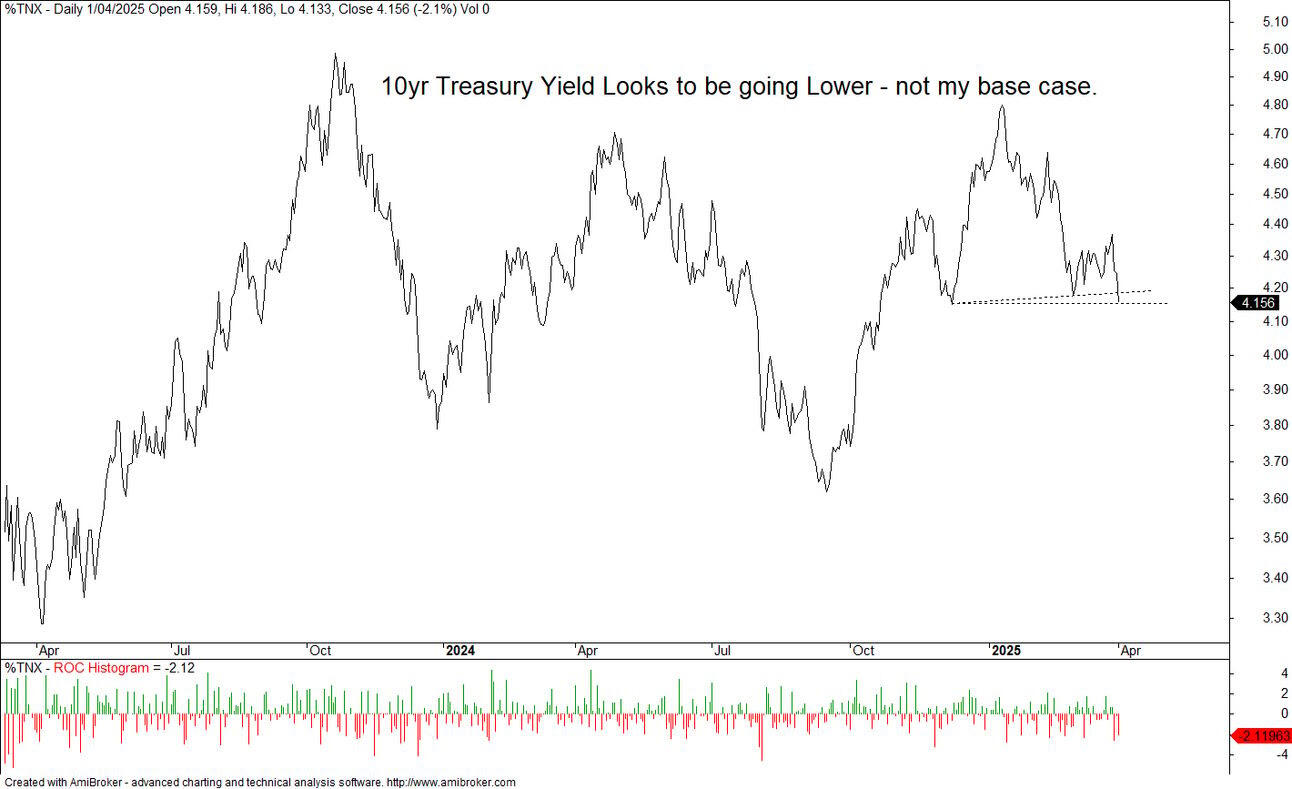
If we zoom in a bit, things are in a very interesting place. I have been calling for higher interest rates based on the huge amount of debt that needs to be refinanced (rolled over) in the next 4 years. As with most things in my life, I am probably early. This chart looks like it wants to go lower; we are looking at yield, not price.
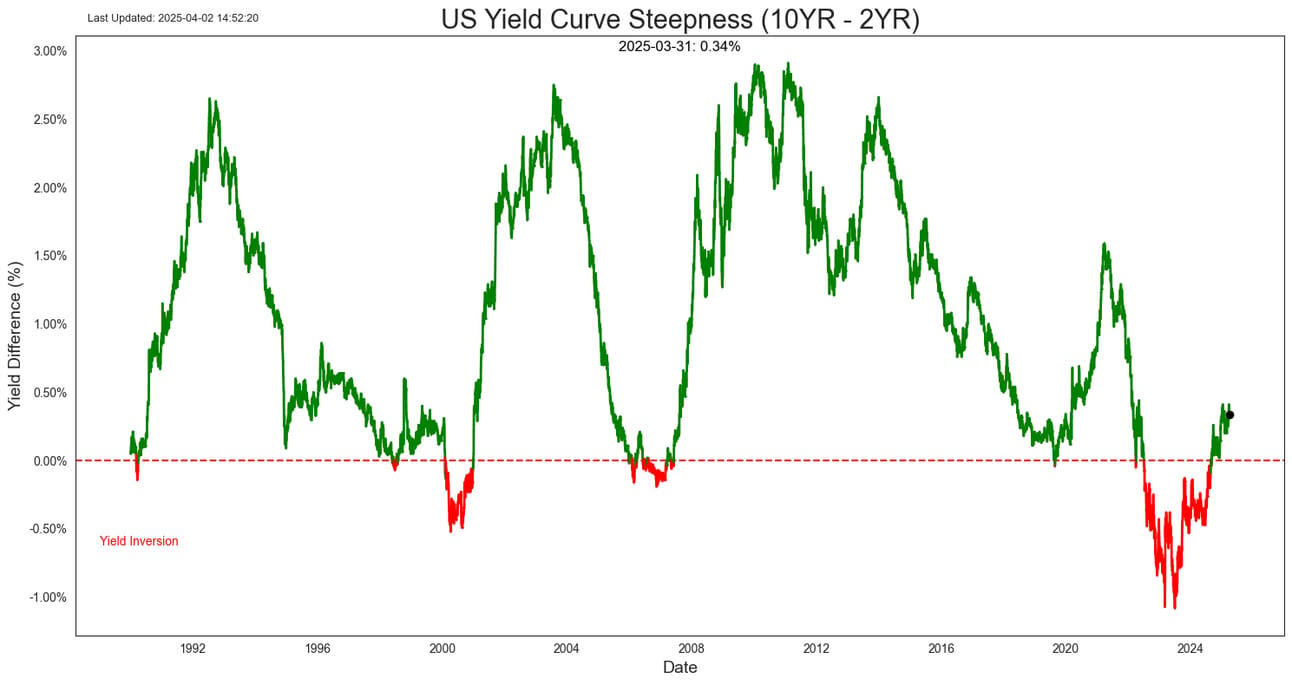
If you have been reading me for a while, you will remember that my favoured way of trading the current bond market is in 2 ways. I have been saying to trade a yield steepener. There are actually ETNs and 2 ETFs that offer to do this for you, i.e., go long 2 years and short 10 years. So despite the long end trading lower in yield, the steepness is much the same. The other idea is to short junk bonds and go long on short-term treasuries.
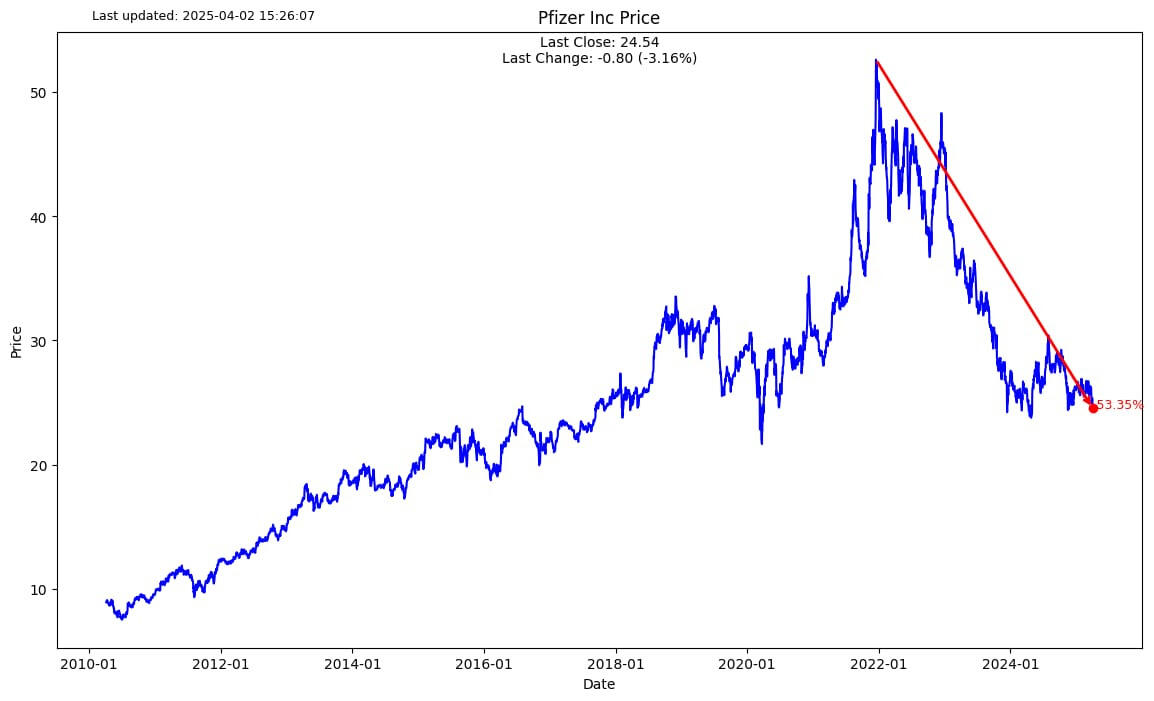
I was just scrolling through some charts and nearly fell off my chair. During the pandemic, when Pfizer came up with the vaccine everyone wanted, I thought these guys were on their way to becoming the most valuable company in the world.
I honestly don’t think I have looked at their share price in 3 or 4 years. Yikes, down more than 53%. It looks like it wants to go lower. It is currently paying a 7% annual dividend. It seems quite tasty, but 10% sounds a lot tastier?
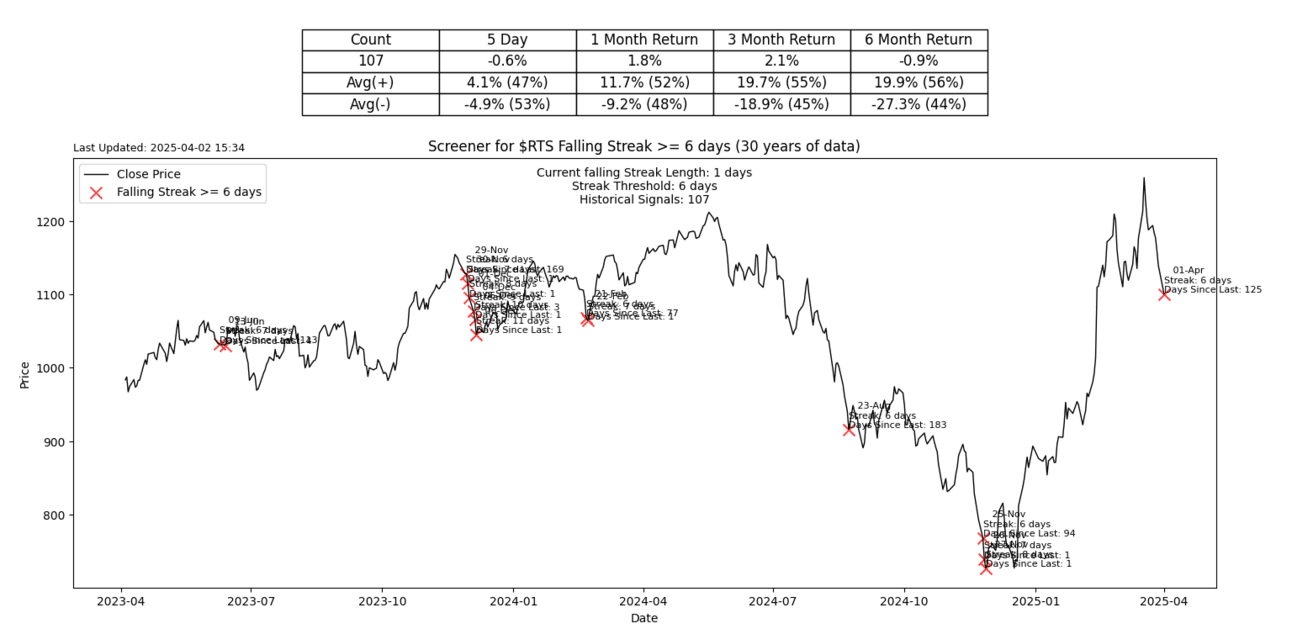
S2N screener alert
The Russian Stock Exchange Index is down 6 days in a row.
S2N performance review
S2N chart gallery
S2N news today

Author

Michael Berman, PhD
Signal2Noise (S2N) News
Michael has decades of experience as a professional trader, hedge fund manager and incubator of emerging traders.


