No news is good news

USD: Mar '24 is Up at 102.190.
Energies: Feb '24 Crude is Up at 72.17.
Financials: The Mar '24 30 Year T-Bond is Down 19 ticks and trading at 121.30.
Indices: The Dec '23 S&P 500 emini ES contract is 88 ticks Lower and trading at 4781.75.
Gold: The Feb'24 Gold contract is trading Up at 2040.00.
Initial conclusion
This is not a correlated market. The USD is Up and Crude is Up which is not normal, but the 30 Year T-Bond is trading Lower. The Financials should always correlate with the US dollar such that if the dollar is Higher, then the bonds should follow and vice-versa. The S&P is Lower and Crude is trading Higher which is correlated. Gold is trading Higher which is not correlated with the US dollar trading Up. I tend to believe that Gold has an inverse relationship with the US Dollar as when the US Dollar is down, Gold tends to rise in value and vice-versa. Think of it as a seesaw, when one is up the other should be down. I point this out to you to make you aware that when we don't have a correlated market, it means something is wrong. As traders you need to be aware of this and proceed with your eyes wide open. Asia is trading mainly Higher with the exception of the Hang Seng which is Lower. Currently all of Europe is trading Lower.
Possible challenges to traders
-
NFIB Small Business Index is out at 6 AM EST. This is Major.
-
Trade Balance is out at 8:30 AM EST. This is Major.
-
RCM/TIPP Economic Optimism - Tentative. This is Major.
-
FOMC Member Barr Speaks at 12 noon EST. This is Major.
Treasuries
Traders, please note that we've changed the Bond instrument from the 30 year (ZB) to the 10 year (ZN). They work exactly the same.
We've elected to switch gears a bit and show correlation between the 10-year bond (ZN) and the S&P futures contract. The S&P contract is the Standard and Poor's, and the purpose is to show reverse correlation between the two instruments. Remember it's likened to a seesaw, when up goes up the other should go down and vice versa.
Yesterday the ZN migrated Higher at around 9 AM EST as the S&P hit a High at around the same time. If you look at the charts below the S&P gave a signal at around 9 AM and the ZN started its Upward trend. Look at the charts below and you'll see a pattern for both assets. S&P hit a High at around 9 AM and migrated Lower. These charts represent the newest version of MultiCharts and I've changed the timeframe to a 15-minute chart to display better. This represented a Long opportunity on the 10-year note, as a trader you could have netted about a 20 plus ticks per contract on this trade. Each tick is worth $15.625. Please note: the front month for the ZN is now Mar '24. The S&P contract is now Mar' 24. I've changed the format to filled Candlesticks (not hollow) such that it may be more apparent and visible.
Charts courtesy of MultiCharts built on an AMP platform
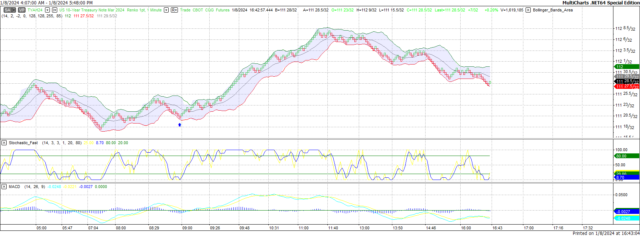
ZN - Mar 2024 - 01/08/24
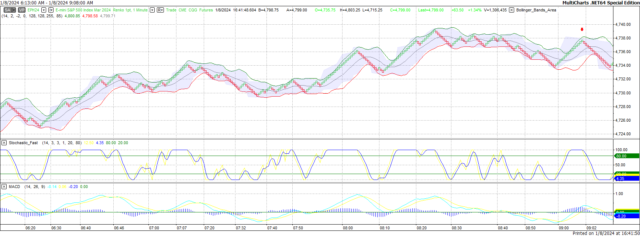
S&P - Mar 2024 - 01/08/24
Bias
Yesterday we gave the markets a Neutral bias as we didn't see much in the way of correlation Monday morning. The markets migrated Higher as the Dow gained 217 points and the other indices gained ground as well. Today we aren't dealing with a correlated market and our bias is to the Downside.
Could this change? Of Course. Remember anything can happen in a volatile market.
Commentary
Yesterday it was difficult to tell what the market direction would be and as such gave the markets a Neutral bias which means it could go anywhere. But what surprised us was there wasn't any real, major economic news on tap yesterday, yet the indices soared. All three major indices leaped to the Upside. I get the old saying is correct, sometime no news is good news. Today we have Trade Balance and an FOMC member speaking. Will this be enough to keep the momentum moving forward? As in all things, only time will tell.
Author

Nick Mastrandrea
Market Tea Leaves


