Nifty 50: Is the Indian Stock Market Entering in a Bear Market?

The Indian stock index Nifty 50 shows signs of exhaustion of the bullish cycle that began in March 2009.
The bearish sentiment could be expanding, dragged by the effects of the coronavirus on the global economy. During this year, the leading Indian index lost 5.23% of its profits.
The Nifty 50, in its logarithmic scale weekly chart, reveals a bullish sequence of five waves. This impulsive structure began in early March 2009 once the Indian index found support at 2,555.60 pts and reached its high record in January 2020, located at 12,430.50 pts.
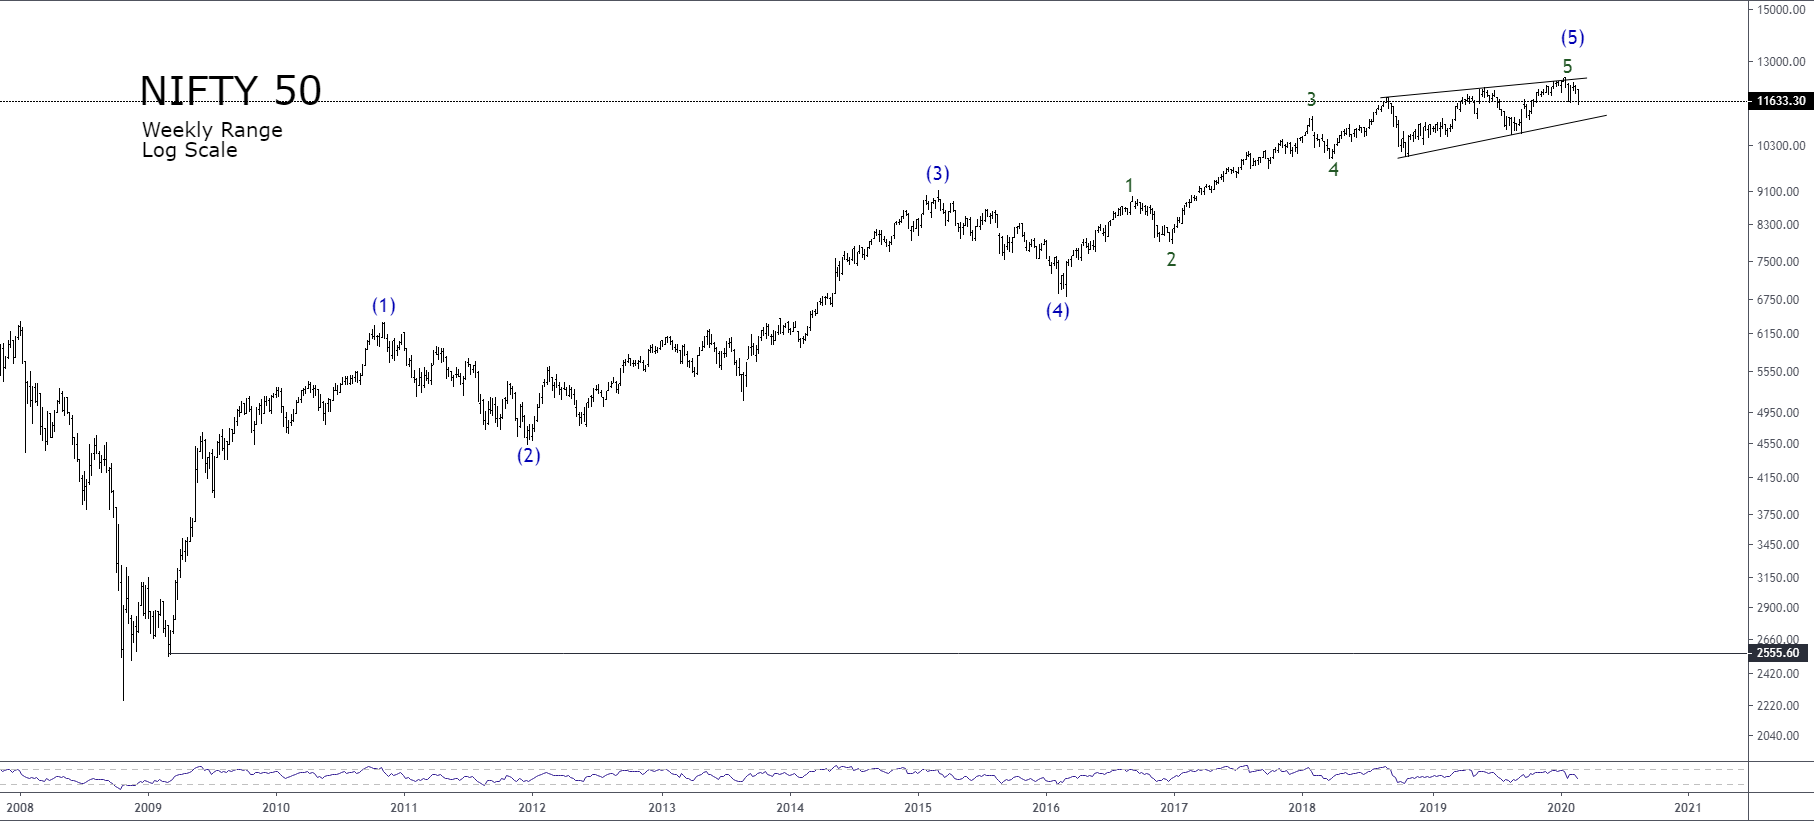
From an Elliott wave's perspective, on the previous figure, we see the Nifty 50 advancing in a wave (5) of Intermediate degree labeled in blue, which at the same time, is completing a wave 5 of Minor degree identified in green.
Also, on the fifth wave of Intermediate degree, we see that its internal structure is developing an ending diagonal formation.
The Elliott wave theory defines the ending diagonal as a pattern that holds five waves that overlap each other. This formation follows an internal sequence subdivided as 3-3-3-3-3. Additionally, the ending diagonal structure can be found in waves "5" or "C."
The next chart depicts to Nifty in its daily timeframe. On the figure, we observe the theoretical model defined by R.N. Elliott, and how Nifty 50 follows this model.
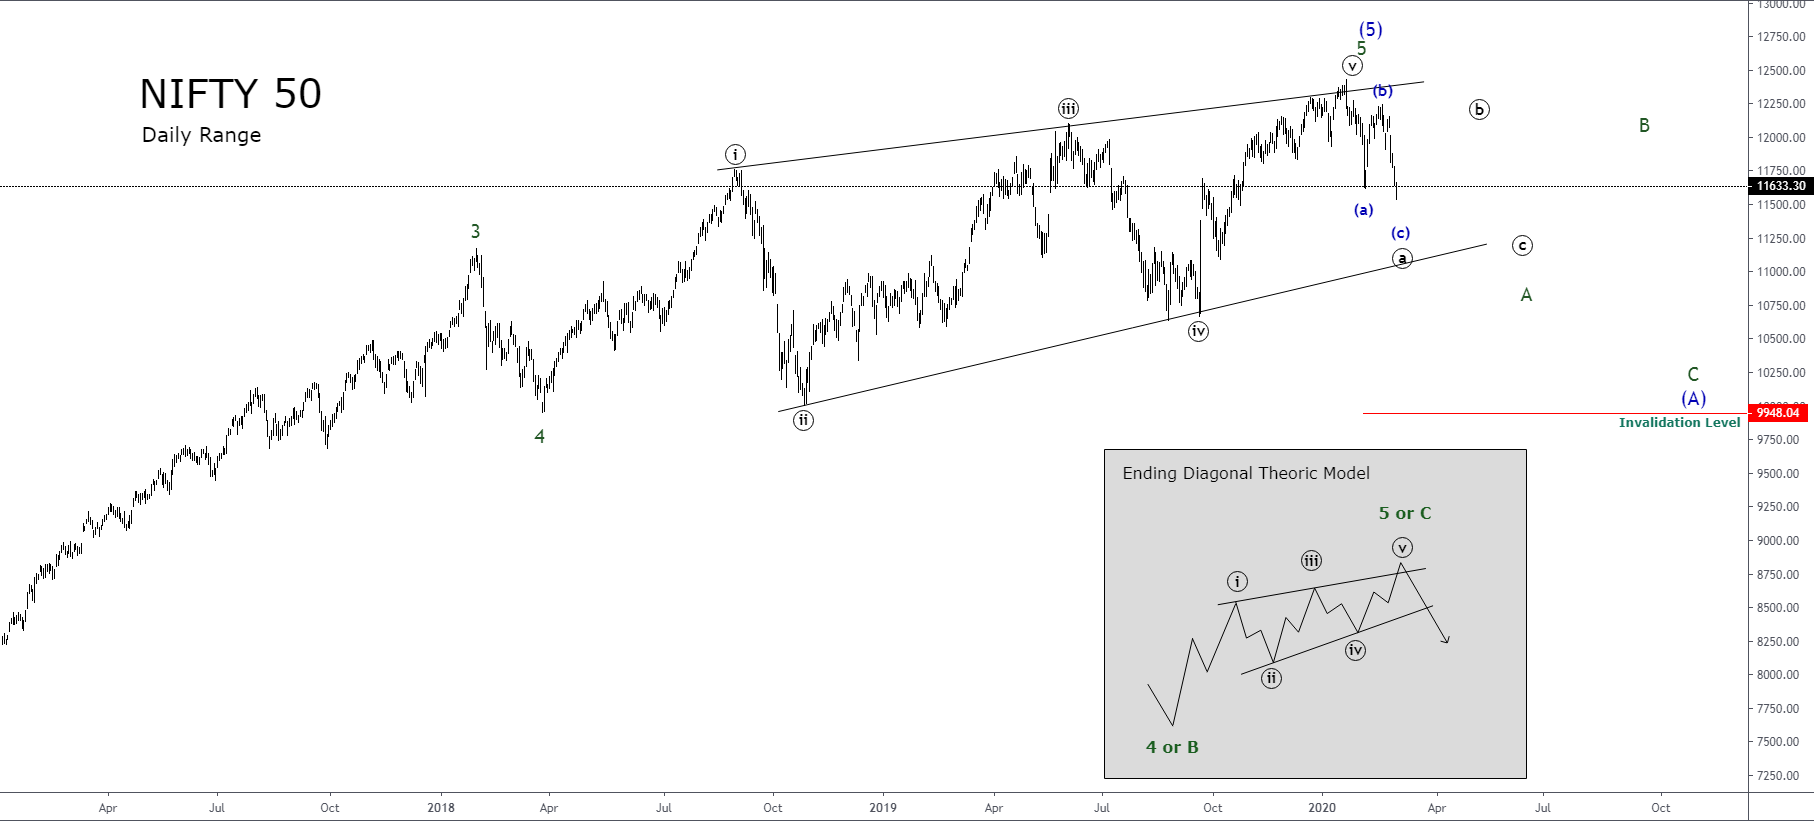
Currently, the Indian stock market entered a corrective process, which makes us expect more declines in the near-term. The internal sequence observed in Nifty 50 reveals the bearish advance of the wave (a) of Minuette degree in blue, which corresponds to the first leg of wave ((a)) of Minute degree in black.
At the same time, the inner structure of Nifty 50 unveiled in its 2-hour chart reveals the bearish advance of a wave iii of Subminuette degree labeled in green.
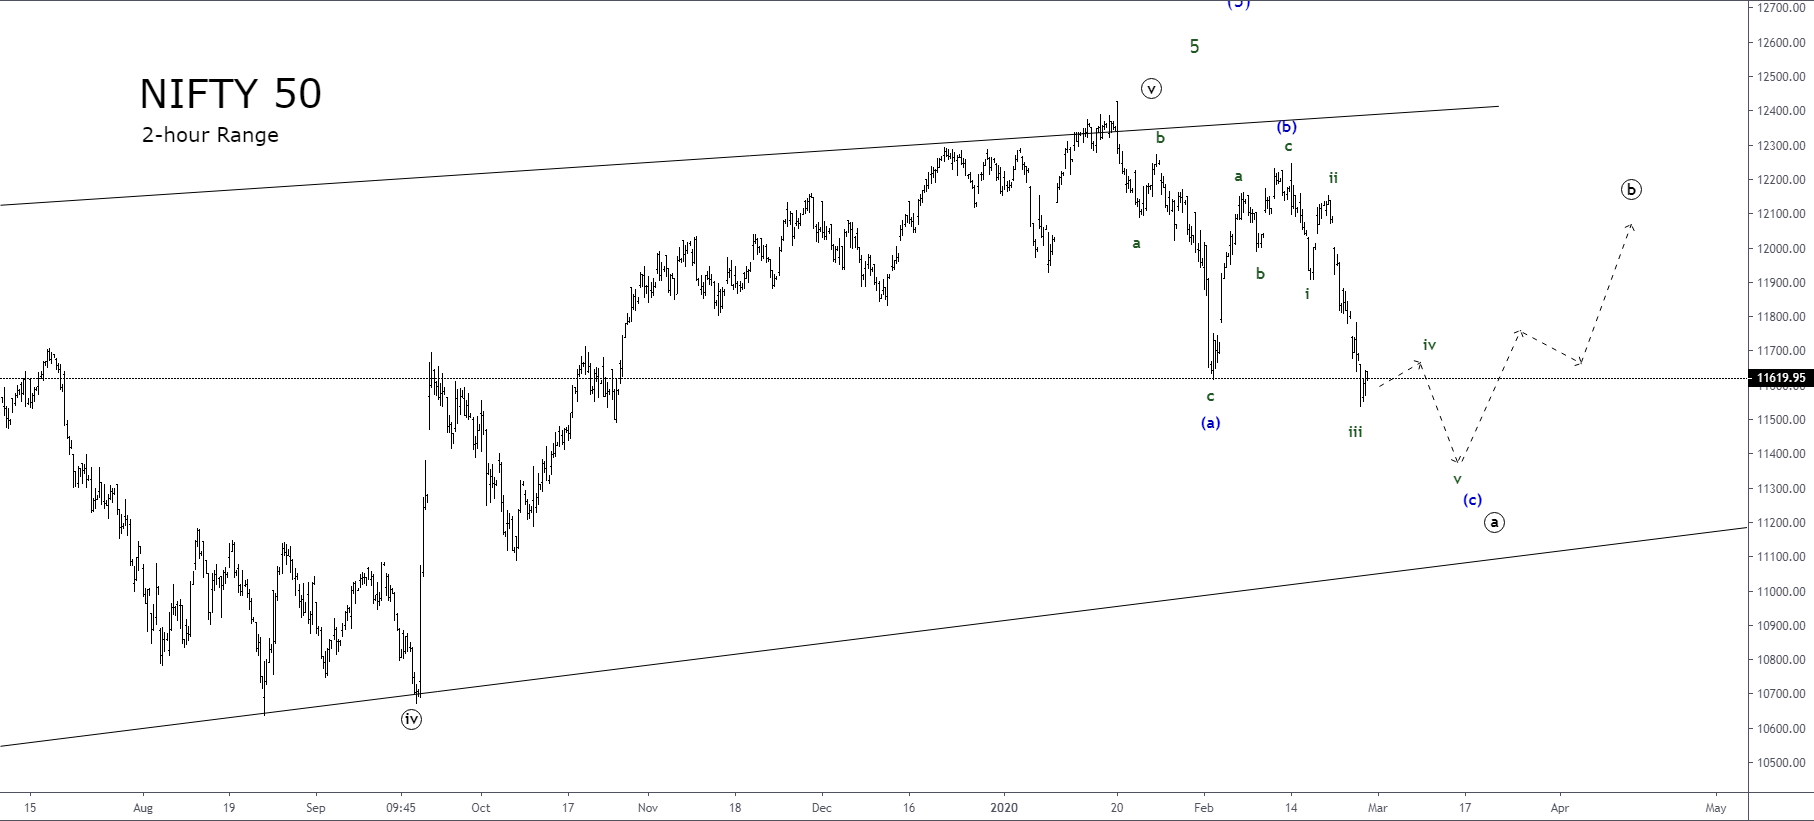
In the coming sessions, the Indian stock market could make a new short-term lower low, which should complete the wave (c) of Minuette degree that belongs to wave ((a)) of Minute degree in black. This movement should give way to a bounce in three sub-waves corresponding to wave ((b)) of Minute degree.
In conclusion, short-term traders could wait for a bounce, which may correspond to the likely progress of the future wave ((b)) of Minute degree in black. However, long-term traders should wait for the end of that ((b)) wave, and look for the next wave ((c)) of Minute degree, which will drag down the Indian stock index following a five-wave structure.
Elliott Wave Summary

Author

EagleFX Team
EagleFX
EagleFX Team is an international group of market analysts with skills in fundamental and technical analysis, applying several methods to assess the state and likelihood of price movements on Forex, Commodities, Indices, Metals and


