NIFTY 50 expecting short-term recovery

On February 27th, in our analysis of the Indian benchmark index NIFTY 50, we commented that its price was developing a possible Ending Diagonal structure, which suggested more declines in the short-term.
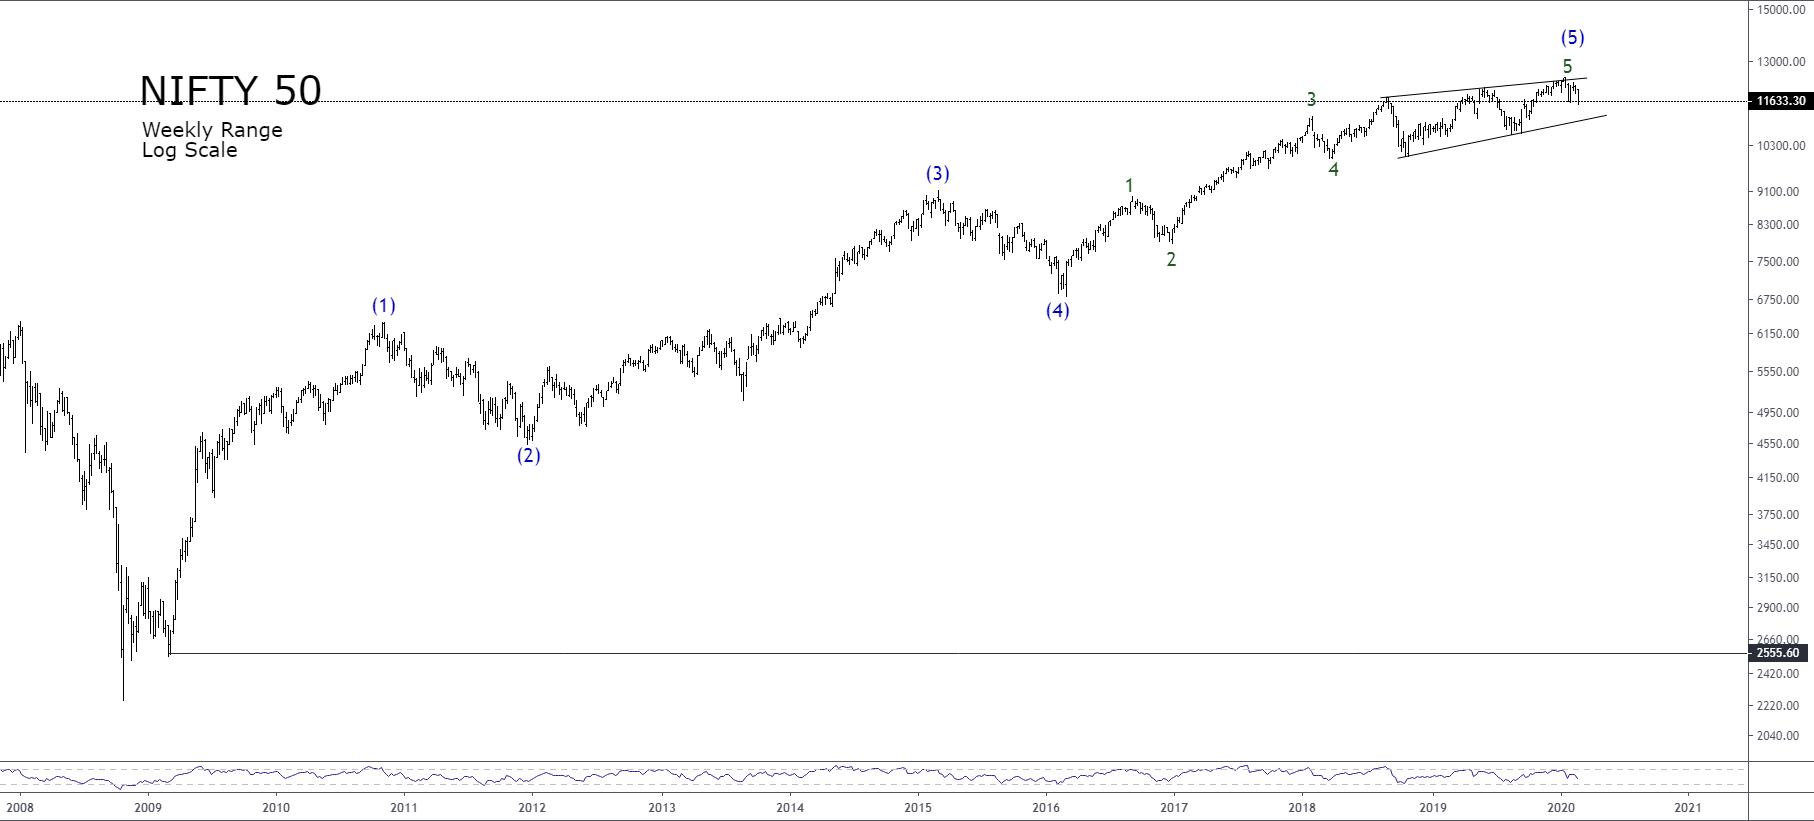
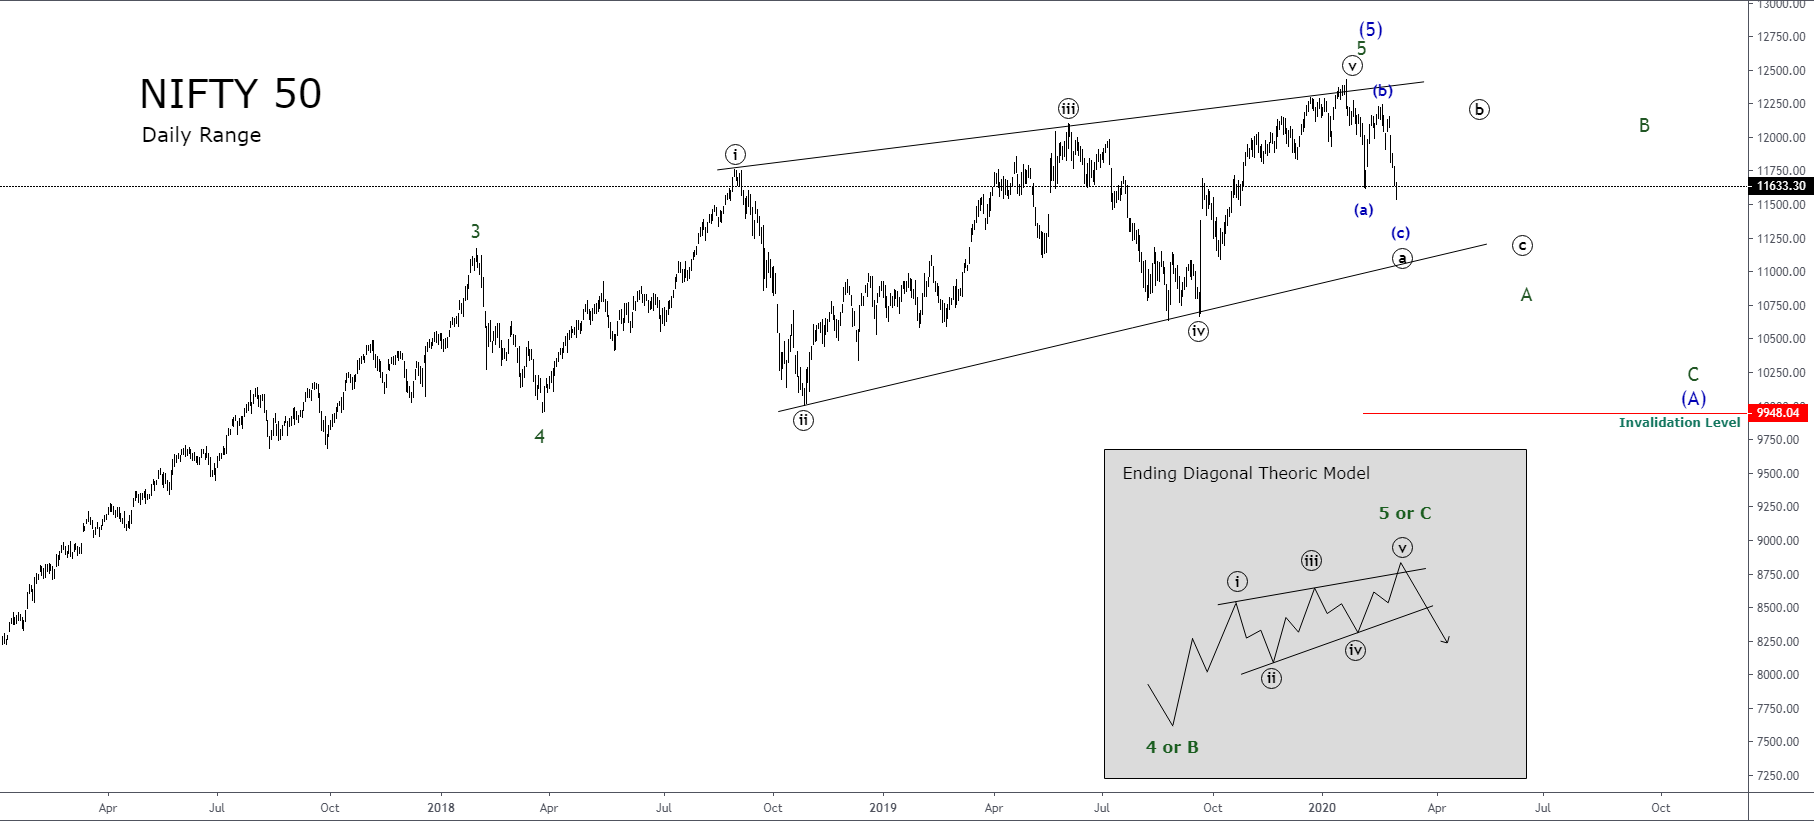
This terminal sequence was unfolding in a context of changing sentiment in the news media from euphoric to worrying. That is, until a previous couple of trading sessions, NIFTY 50 reached its all-time high at 12,430.50 pts, when the context was based on the euphoric sentiment originated on earnings exceeding analyst's expectations.
However, once the first drops were registered after the record high, the news about the potential impact on the global economy of COVID-19 began to take hold on the media.
In the first instance, looking at the following chart, there was the possibility that the first drop could go to the 10,700 pts zone that confluences with the end of wave ((iv)) in black, where it could bounce to 11,900 pts, which corresponds the end zone of wave ((i)) of Minute degree labeled in black.
However, in our March 11th update, we saw the price plummeted below the zone of wave ((iv)) of the diagonal ending pattern.
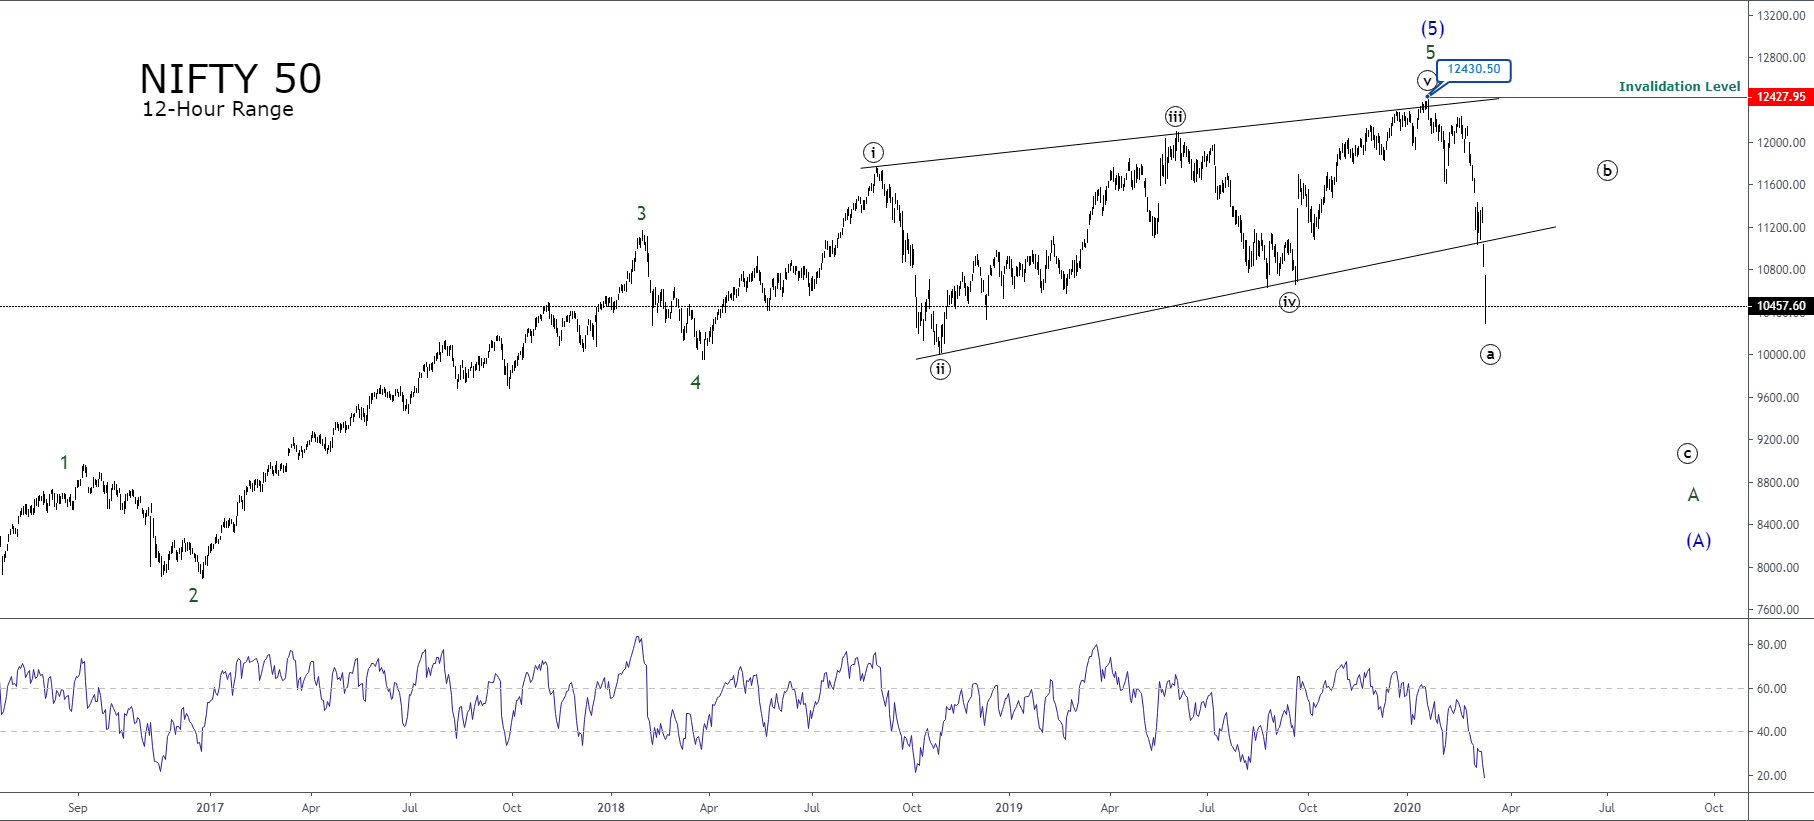
This fall led us to anticipate that the index could experience deeper falls in the medium term, which could even go as far as the 9,100 pts area. This zone corresponds to the high of wave 1 of Minor degree labeled in green, which in turn belongs to the fifth wave of Intermediate degree.
Once NIFTY 50 found its bottom at 7,511.10 pts on March 24th, the price found fresh buyers that led the Indian index in an upward five-wave sequence that met resistance at 9,038.90 pts, where the Indian benchmark index started to drop in a three-wave structure.
Currently, the 2-hour chart shows the Indian index developing a new corrective movement that could belong to a wave ((ii)) or ((b)) in black, which is still in development.
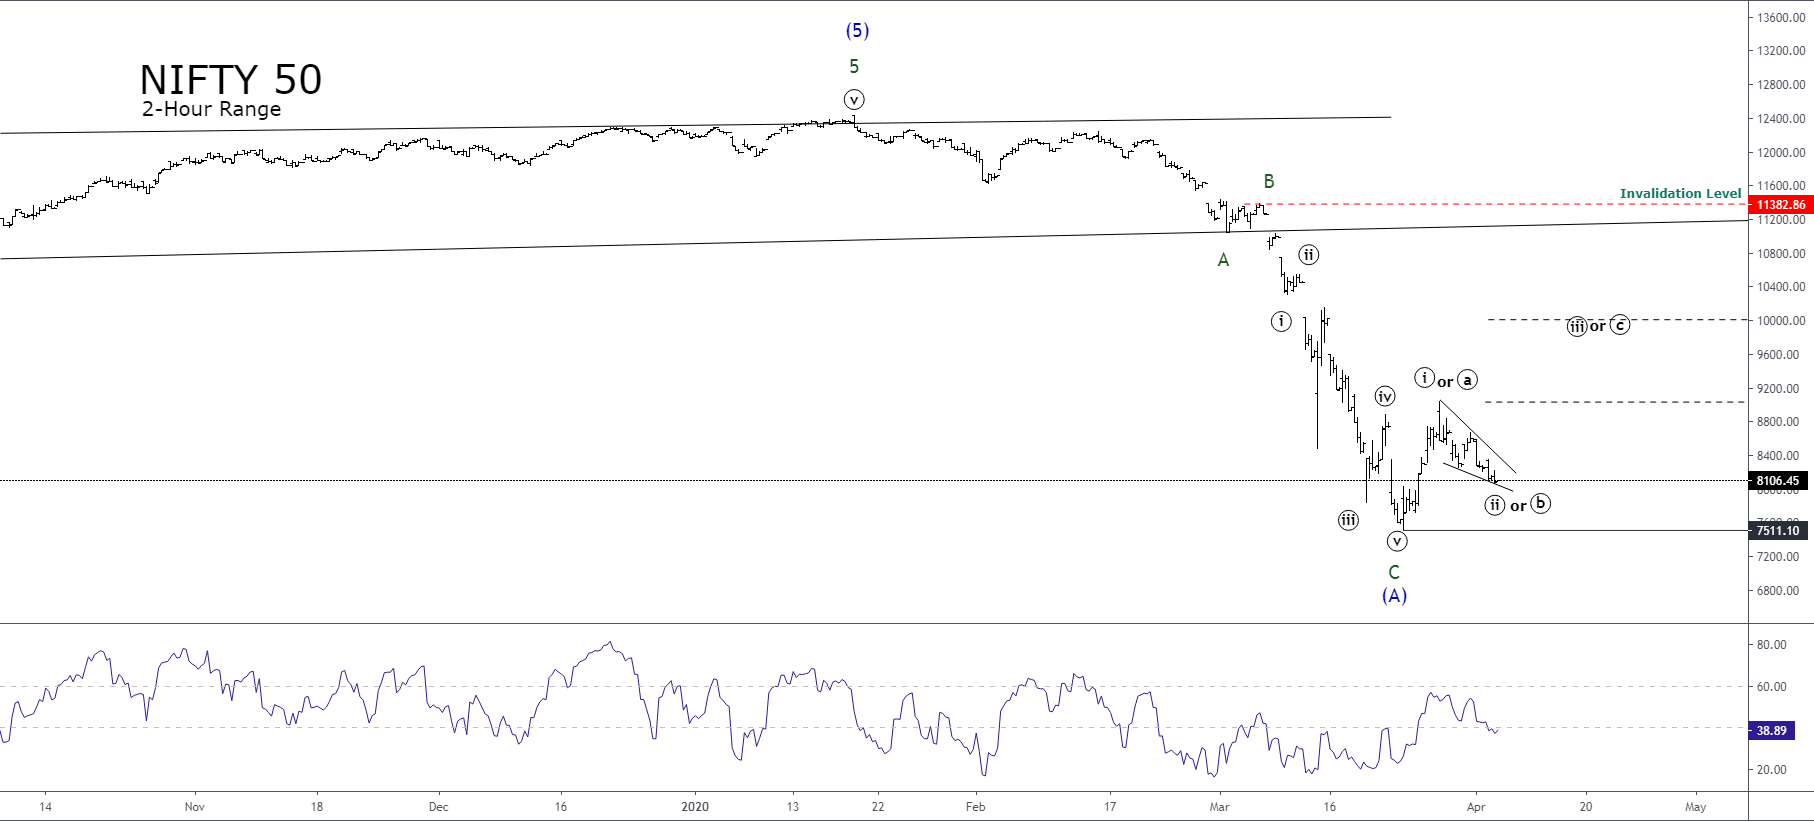
This movement occurs in a context where news media talks about recession, city lockdown, as the unemployment rate increases. This extreme bearish sentiment heightened by news media leads us to support our upward bias in the short-term. This bias could be limited to a short period, at least until the start of the Q1 earnings release.
On the previous chart, we observe that the next levels to watch are 9,000 pts that corresponds to pivot zone created by the end of wave 1 of Minor degree labeled in green and 10,000 pts that corresponds to the end of waves 4 in green and ((ii)) in black corresponding to the ending diagonal pattern.
In conclusion, in the short-term, our preferred positioning remains on the buy-side as long as the price remains above 7,511.10 pts. However, the big picture suggests that the upward sequence corresponds to a wave (B) of Intermediate degree, and the mid-term outlook points to prices making a new lower low.
Author

EagleFX Team
EagleFX
EagleFX Team is an international group of market analysts with skills in fundamental and technical analysis, applying several methods to assess the state and likelihood of price movements on Forex, Commodities, Indices, Metals and


