USD: Dec '24 is Down at 103.475.

Energies: Nov '24 Crude is Down at 69.82.

Financials: The Dec '24 30 Year T-Bond is Down 4 ticks and trading at 119.28.

Indices: The Dec '24 S&P 500 emini ES contract is 48 ticks Higher and trading at 5899.00.

Gold: The Dec'24 Gold contract is trading Up at 2727.00.

Initial conclusion

This is not a correlated market.  The USD is Down and Crude is Down which is not normal, and the 30 Year T-Bond is trading Lower.  The Financials should always correlate with the US dollar such that if the dollar is Higher, then the bonds should follow and vice-versa. The S&P is Higher and Crude is trading Lower which is correlated. Gold is trading Higher which is correlated with the US dollar trading Down.  I tend to believe that Gold has an inverse relationship with the US Dollar as when the US Dollar is down, Gold tends to rise in value and vice-versa. Think of it as a seesaw, when one is up the other should be down. I point this out to you to make you aware that when we don't have a correlated market, it means something is wrong. As traders you need to be aware of this and proceed with your eyes wide open. All of Asia traded Higher.  All of Europe is trading Higher with the exception of the London and Spanish IBEX exchanges. 

Possible challenges to traders

  • Building Permits is out at 8:30 AM EST. This is Major.

  • Housing Starts is out at 8:30 AM EST. This is Major.

  • FOMC Member Waller speaks at 12:10 PM EST. This is Major.

  • Federal Budget Balance is tentative. This is Major.

Traders, please note that we've changed the Bond instrument from the 10 year (ZN) to the 2 year (ZT). They work exactly the same.  

We've elected to switch gears a bit and show correlation between the 2-year Treasury notes (ZT) and the S&P futures contract.  The YM contract is the Dow Jones Industrial Average, and the purpose is to show reverse correlation between the two instruments.  Remember it's likened to a seesaw, when up goes up the other should go down and vice versa.

Yesterday the ZT migrated Lower at around 8:30 AM EST as we had several economic reports at the same time and began its Downward Slide.  Look at the charts below and you'll see a pattern for both assets. The Dow moved Higher at 8:30 AM and the ZT moved Lower at around the same time.  These charts represent the newest version of Bar Charts, and I've changed the timeframe to a 15-minute chart to display better.  This represented a Short opportunity on the 2-year note, as a trader you could have netted about 40 plus ticks per contract on this trade.   Each tick is worth $7.625.  Please note: the front month for ZT is Dec and the Dow is now Dec '24.  I've changed the format to filled Candlesticks (not hollow) such that it may be more apparent and visible.

Charts courtesy of barcharts

ZT

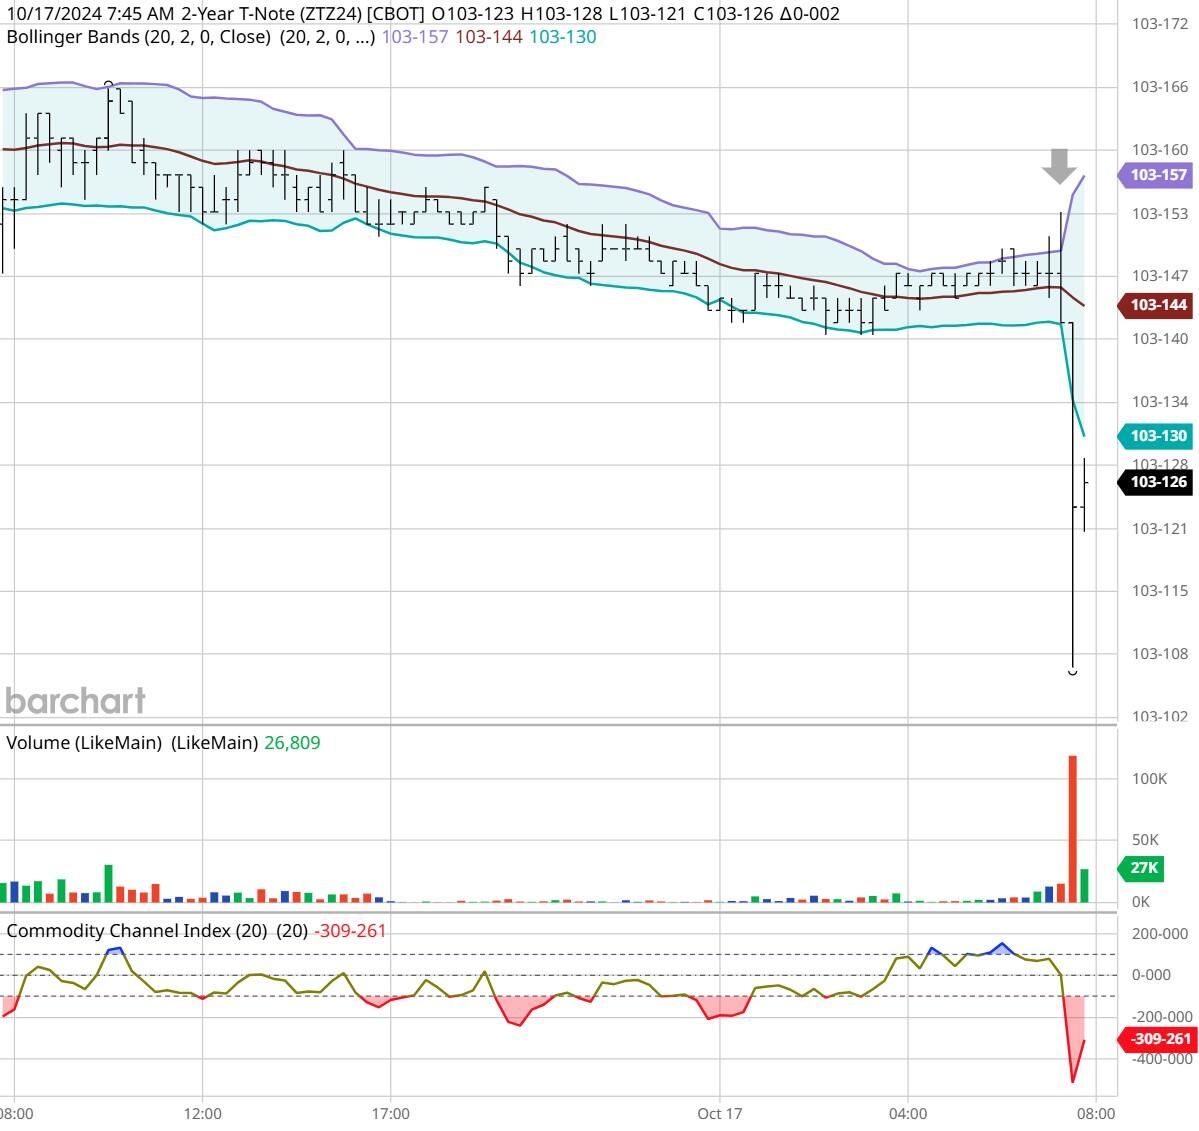
ZT -Dec 2024 - 10/17/24

Chart

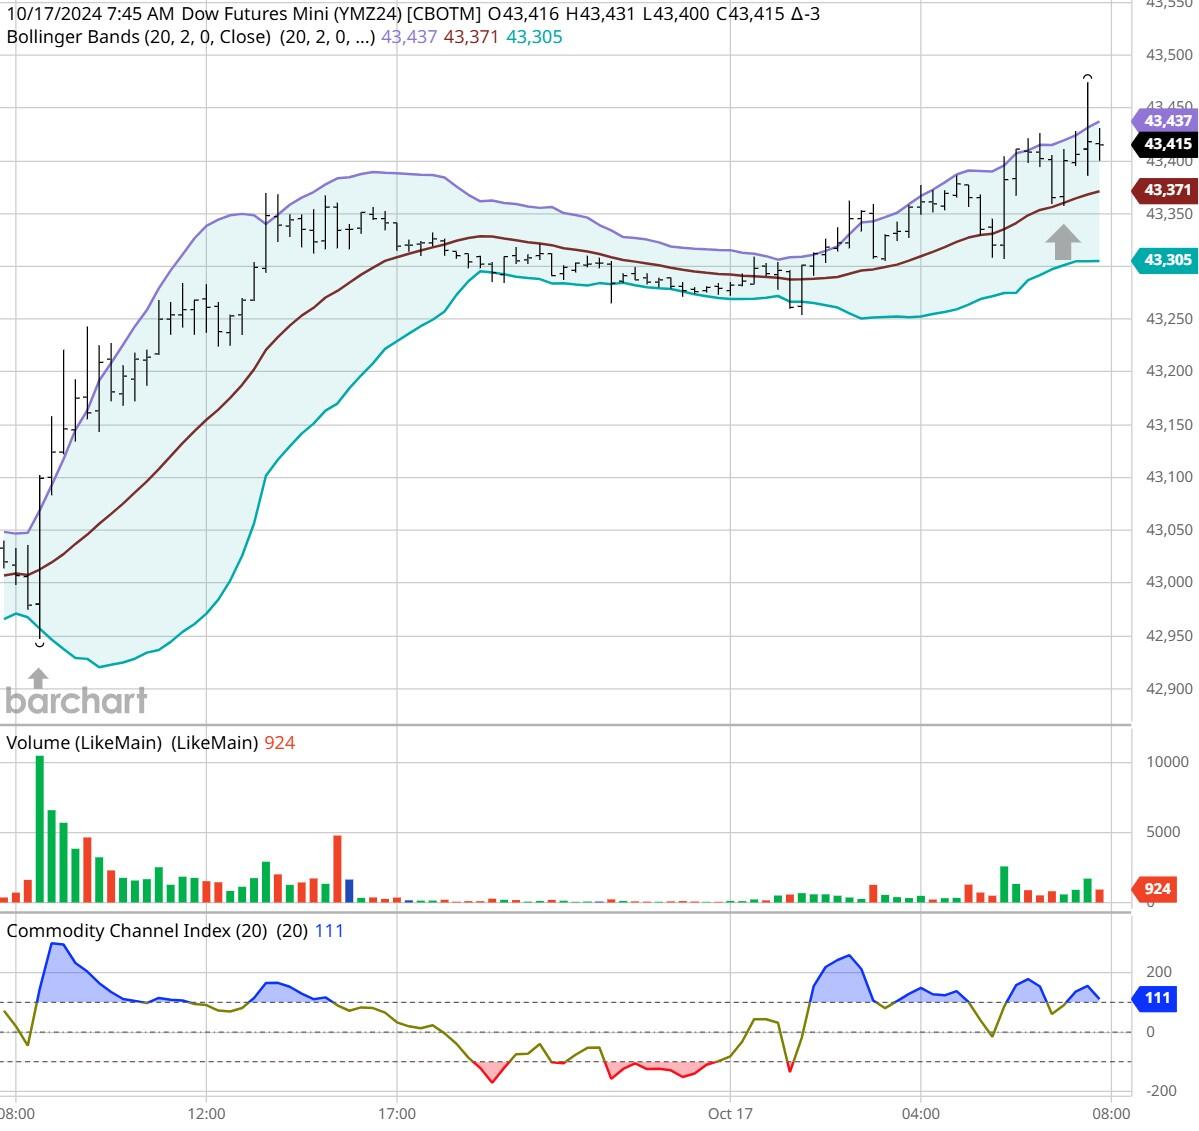
Dow - Dec 2024- 17/24

Bias

Yesterday we gave the markets an Upside bias as the USD and the Bonds were trading Lower Thursday morning and the markets (for the most part) kept its Upside momentum with the Dow gaining 161 points with only the S&P dropping by 1 point.  Today we aren't dealing with a correlated market, and our bias is to the Upside.

Could this change? Of Course. Remember anything can happen in a volatile market.

Commentary

Yesterday we had a true news tsunami with about 13 economic reports scheduled for release.  This did not deter the market momentum as only the S&P dropped by one point, which isn't bad considered the number of reports scheduled. Today we have Building Permits and Housing Starts which are key to the real estate markets. Will this continue the positive momentum of late? Only time will tell.

Trading performance displayed herein is hypothetical. The following Commodity Futures Trading Commission (CFTC) disclaimer should be noted.

Hypothetical performance results have many inherent limitations, some of which are described below. No representation is being made that any account will or is likely to achieve profits or losses similar to those shown.

In fact, there are frequently sharp differences between hypothetical performance results and the actual results subsequently achieved by any particular trading program. One of the limitations of hypothetical performance trading results is that they are generally prepared with the benefit of hindsight.

In addition, hypothetical trading does not involve financial risk, and no hypothetical trading record can completely account for the impact of financial risk in actual trading. For example, the ability to withstand losses or to adhere to a particular trading program in spite of trading losses are material points which can also adversely affect actual trading results.

There are numerous other factors related to the markets in general or to the implementation of any specific trading program which cannot be fully accounted for in the preparation of hypothetical performance results and all of which can adversely affect actual trading results.

Trading in the commodities markets involves substantial risk and YOU CAN LOSE A LOT OF MONEY, and thus is not appropriate for everyone. You should carefully consider your financial condition before trading in these markets, and only risk capital should be used.

In addition, these markets are often liquid, making it difficult to execute orders at desired prices. Also, during periods of extreme volatility, trading in these markets may be halted due to so-called “circuit breakers” put in place by the CME to alleviate such volatility. In the event of a trading halt, it may be difficult or impossible to exit a losing position.

Recommended Content


Recommended Content

Editors’ Picks

EUR/USD clings to recovery gains near 1.0850 ahead of Fedspeak

EUR/USD clings to recovery gains near 1.0850 ahead of Fedspeak

EUR/USD trades in positive territory near 1.0850 on Friday following a four-day slide. China's stimulus optimism and a broad US Dollar correction help the pair retrace the dovish ECB decision-induced decline. All eyes remain on the Fedspeak. 

EUR/USD News
GBP/USD pares UK data-led gains at around 1.3050

GBP/USD pares UK data-led gains at around 1.3050

GBP/USD is trading at around 1.3050 in the second half of the day on Friday, supported by upbeat UK Retail Sales data and a pullback seen in the US Dollar. Later in the day, comments from Federal Reserve officials will be scrutinized by market participants.

GBP/USD News
Gold at new record peaks above $2,700 on increased prospects of global easing

Gold at new record peaks above $2,700 on increased prospects of global easing

Gold (XAU/USD) establishes a foothold above the $2,700 psychological level on Friday after piercing through above this level on the previous day, setting yet another fresh all-time high. Growing prospects of a globally low interest rate environment boost the yellow metal.

Gold News
Crypto ETF adoption should pick up pace despite slow start, analysts say

Crypto ETF adoption should pick up pace despite slow start, analysts say

Big institutional investors are still wary of allocating funds in Bitcoin spot ETFs, delaying adoption by traditional investors. Demand is expected to increase in the mid-term once institutions open the gates to the crypto asset class.

Read more
Canada debates whether to supersize rate cuts

Canada debates whether to supersize rate cuts

A fourth consecutive Bank of Canada rate cut is expected, but the market senses it will accelerate the move towards neutral policy rates with a 50bp step change. Inflation is finally below target and unemployment is trending higher, but the economy is still growing.

Read more
Best Forex Brokers with Low Spreads

Best Forex Brokers with Low Spreads

VERIFIED Low spreads are crucial for reducing trading costs. Explore top Forex brokers offering competitive spreads and high leverage. Compare options for EUR/USD, GBP/USD, USD/JPY, and Gold.

Read More

Majors

Cryptocurrencies

Signatures