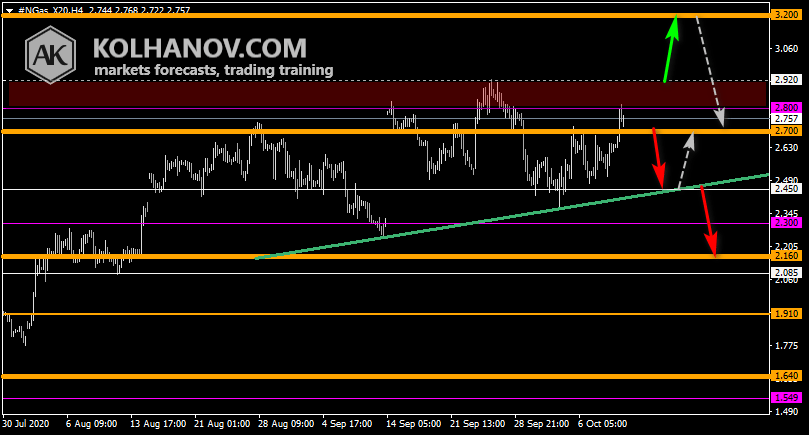
Nat gas: Uptrend will start if it rises above 2.700 resistance level

Thursday Forecast
Uptrend scenario
An uptrend will start as soon, as the market rises above resistance level 2.700, which will be followed by moving up to resistance level 2.800 - 2.920.
Downtrend scenario
The downtrend may be expected to continue, while market is trading below resistance level 2.700, which will be followed by reaching support level 2.450.

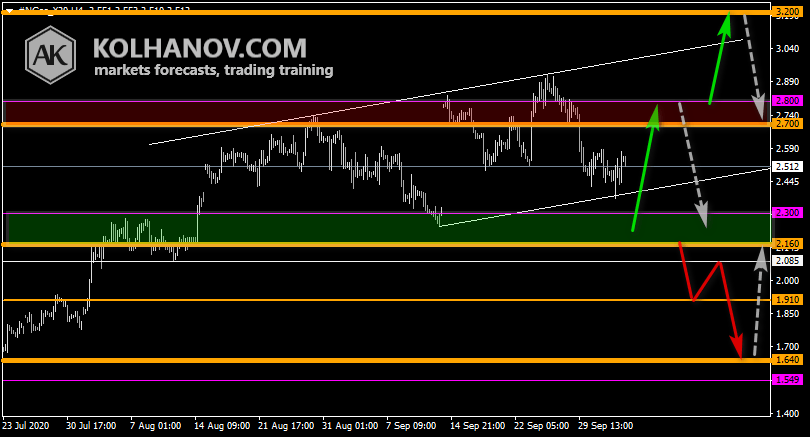
This/Next Week Forecast (October 12 - 16, 2020)
Uptrend scenario
The uptrend may be expected to continue in case the market rises above resistance level 2.920, which will be followed by reaching resistance level 3.200.
Downtrend scenario
An downtrend will start as soon, as the market drops below support level 2.700, which will be followed by moving down to support level 2.450 and if it keeps on moving down below that level, we may expect the market to reach support level 2.160.
Previous week natural gas forecast chart
Fundamental Analysis
Difference between supply and demand showing fair price on the level 2.7.

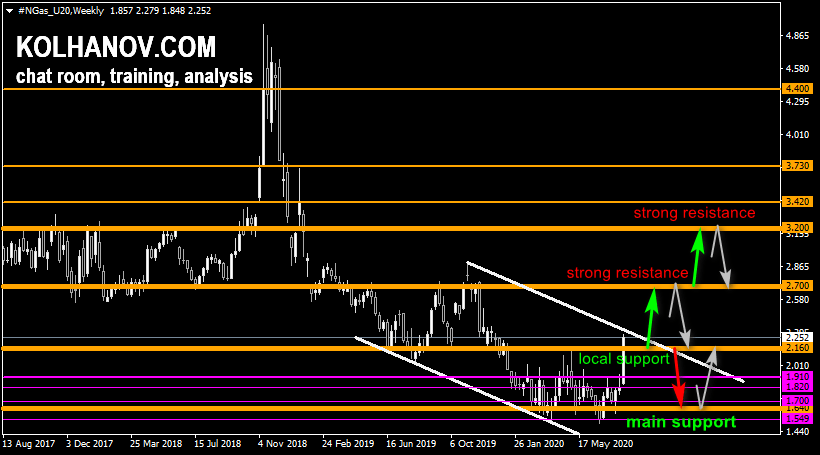
Long-Term Forecast (Quarter III: July - September, 2020)
Uptrend scenario
The uptrend may be expected to continue, while market is trading above support level 2.160, which will be followed by reaching resistance level 2.700.
Downtrend scenario
An downtrend will start as soon, as the market drops below support level 2.160, which will be followed by moving down to support level 1.640.
Author

Anton Kolhanov
Anton Kolhanov
Anton Kolhanov is a trader and an analyst. He started to study the Forex market in 2003.


