|

Natural Gas Elliott Wave technical analysis [Video]

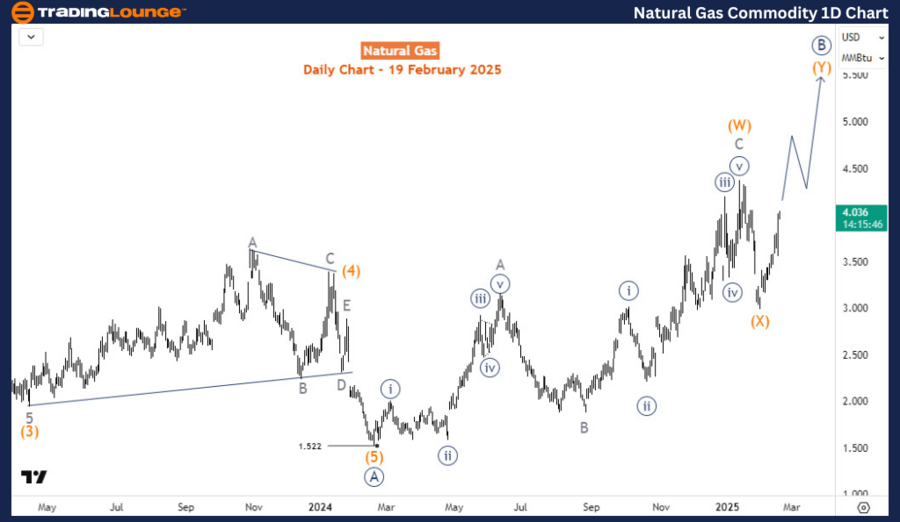
Natural Gas Elliott Wave analysis

Since the shift to the March 2024 contract, Natural gas futures prices have gained over 29% and are close to completely recovering from the sell-off in the previous weeks. On a bigger scale, it appears the commodity will extend the bullish corrective sequence from February 2024.

Natural Gas: Daily chart analysis

On the daily chart, it’s clear the commodity is in a corrective phase that started in February 2024. That low marked the end of a bearish impulse sequence that started in August 2022 when the commodity exchanged for $10. Meanwhile, the corrective sequence from February 2024 is emerging into a double zigzag structure. Wave (W) finished at the peak of January 2025 from where the price dropped to finish wave (X). Wave (Y) started in the last days of January and could extend to the $5.7-$6.8 price zone. Thus, the upside is favored to continue in the short term. However, until the top of wave (W) is breached, traders should be cautious of a lower wave (X) in a double zigzag structure.

GAS

Natural Gas: Four-hour chart analysis

On the H4 chart, the price is currently in wave A of (Y) with an impulse wave pattern. Thus, after wave A, traders should expect a bullish reaction from the wave B pullback. However, with the current price action, it doesn’t appear that wave A has finished yet - may still extend higher before wave B corrects it.

Chart

Natural Gas Elliott Wave technical analysis [Video]

Author

Peter Mathers

Peter Mathers

TradingLounge

Peter Mathers started actively trading in 1982. He began his career at Hoei and Shoin, a Japanese futures trading company.

More from Peter Mathers
Share:

Markets move fast. We move first.

Orange Juice Newsletter brings you expert driven insights - not headlines. Every day on your inbox.

By subscribing you agree to our Terms and conditions.

Editor's Picks

EUR/USD ticks lower following the release of FOMC Minutes

The US Dollar found some near-term demand following the release of the FOMC meeting minutes, with the EUR/USD pair currently piercing the 1.1750 threshold. The document showed officials are still willing to trim interest rates. Meanwhile, thinned holiday trading keeps major pairs confined to familiar levels.

GBP/USD remains sub- 1.3500, remains in the red

The GBP/USD lost traction early in the American session, maintaining the sour tone and trading around 1.3460 following the release of the FOMC meeting minutes. Trading conditions remain thin ahead of the New Year holiday, limiting the pair's volatility.

Gold stable above $4,350 as the year comes to an end

Gold price got to recover some modest ground on Tuesday, holding on to intraday gains and changing hands at $4,360 a troy ounce in the American afternoon. The bright metal showed no reaction to the release of the FOMC December meeting minutes.

Ethereum: ETH holds above $2,900 despite rising selling activity

Ethereum (ETH) held the $2,900 level despite seeing increased selling pressure over the past week. The Exchange Netflow metric showed deposits outweighed withdrawals by about 400K ETH. The high value suggests rising selling activity amid the holiday season.

Economic outlook 2026-2027 in advanced countries: Solidity test

After a year marked by global economic resilience and ending on a note of optimism, 2026 looks promising and could be a year of solid economic performance. In our baseline scenario, we expect most of the supportive factors at work in 2025 to continue to play a role in 2026.

Crypto market outlook for 2026

Year 2025 was volatile, as crypto often is.  Among positive catalysts were favourable regulatory changes in the U.S., rise of Digital Asset Treasuries (DAT), adoption of AI and tokenization of Real-World-Assets (RWA).