|

Natural Gas Elliott Wave technical analysis [Video]

Natural Gas Elliott Wave analysis 

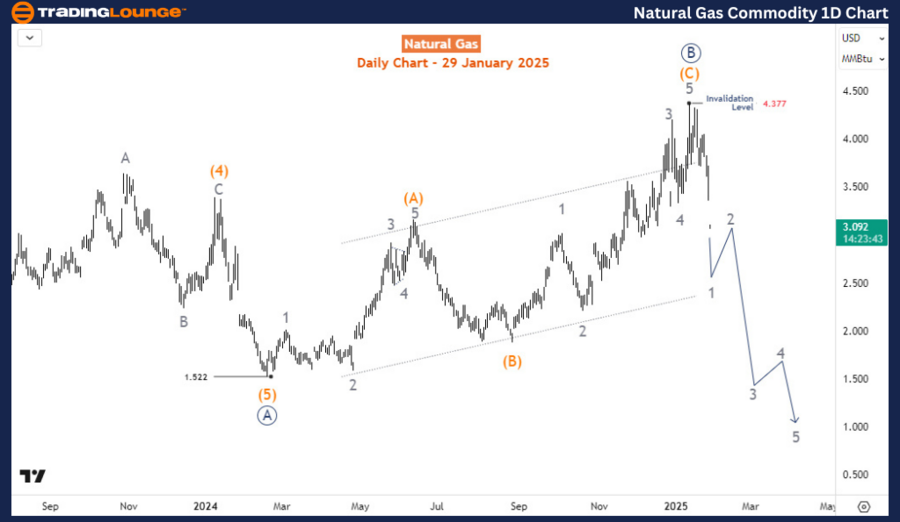
Natural Gas completed the bullish correction that started at the low of February 2024. The recent bearish response suggests that the commodity could be about to resume the larger bearish trend that lasted between August 2022 and February 2024.

Daily chart analysis

The Elliott wave theory is built on 5-3 price sequences. This means a 5-wave trend should be followed by a 3-wave correction. After the end of the correction, the price should resume in the direction of the trend—in another 5-wave sequence. That’s the case with Natural Gas. 

The commodity completed a 5-wave decline - wave ((A)), between August 2022 and February 2024 and then followed by a 3-wave correction identified as wave ((B)). With wave ((B)) ending at the peak of January 2025, wave ((C)) should have started. Thus, we can start counting the sub-waves of ((C)) to prices below the February 2024 low. Wave ((C)) is expected to emerge as a 5-wave sequence.

NG

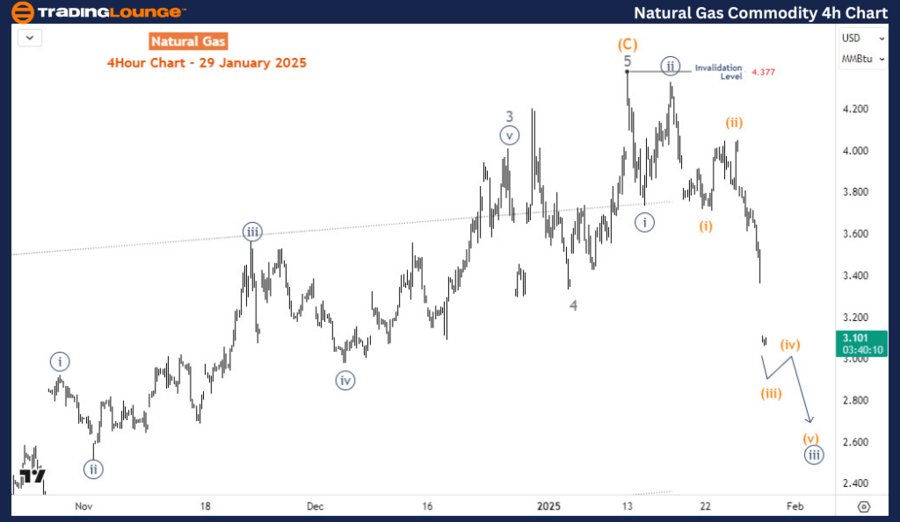
Four-hour chart analysis

On the H4 chart, the sub-waves of ((C)) have started. From the peak of January 2024, a bearish impulse wave is emerging - expected to be for wave 1 of (1) of ((C)). Within wave 1, the price is in wave (iii) of ((iii)). Thus, wave 1 could still extend lower before a bullish correction for wave 2 ensues. Wave 2 bounce could provide an opportunity for sellers to find good entries.

CAS

Natural Gas Elliott Wave technical analysis [Video]

Author

Peter Mathers

Peter Mathers

TradingLounge

Peter Mathers started actively trading in 1982. He began his career at Hoei and Shoin, a Japanese futures trading company.

More from Peter Mathers
Share:

Editor's Picks

EUR/USD hits two-day highs near 1.1820

EUR/USD picks up pace and reaches two-day tops around 1.1820 at the end of the week. The pair’s move higher comes on the back of renewed weakness in the US Dollar amid growing talk that the Fed could deliver an interest rate cut as early as March. On the docket, the flash US Consumer Sentiment improves to 57.3 in February.

GBP/USD reclaims 1.3600 and above

GBP/USD reverses two straight days of losses, surpassing the key 1.3600 yardstick on Friday. Cable’s rebound comes as the Greenback slips away from two-week highs in response to some profit-taking mood and speculation of Fed rate cuts. In addition, hawkish comments from the BoE’s Pill are also collaborating with the quid’s improvement.

Gold climbs further, focus is back to 45,000

Gold regains upside traction and surpasses the $4,900 mark per troy ounce at the end of the week, shifting its attention to the critical $5,000 region. The move reflects a shift in risk sentiment, driving flows back towards traditional safe haven assets and supporting the yellow metal.

Crypto Today: Bitcoin, Ethereum, XRP rebound amid risk-off, $2.6 billion liquidation wave

Bitcoin edges up above $65,000 at the time of writing on Friday, as dust from the recent macro-triggered sell-off settles. The leading altcoin, Ethereum, hovers above $1,900, but resistance at $2,000 caps the upside. Meanwhile, Ripple has recorded the largest intraday jump among the three assets, up over 10% to $1.35.

Three scenarios for Japanese Yen ahead of snap election

The latest polls point to a dominant win for the ruling bloc at the upcoming Japanese snap election. The larger Sanae Takaichi’s mandate, the more investors fear faster implementation of tax cuts and spending plans. 

XRP rally extends as modest ETF inflows support recovery

Ripple is accelerating its recovery, trading above $1.36 at the time of writing on Friday, as investors adjust their positions following a turbulent week in the broader crypto market. The remittance token is up over 21% from its intraday low of $1.12.