|

Natural Gas Elliott Wave technical analysis [Video]

Natural Gas Elliott Wave analysis

Natural Gas broke upside this week and took the previous high of 11th June. The commodity has gained over 120% since the low of February 2024 and has so far recovered close to half of the massive sell-off that happened between August 2022 and February 2024.

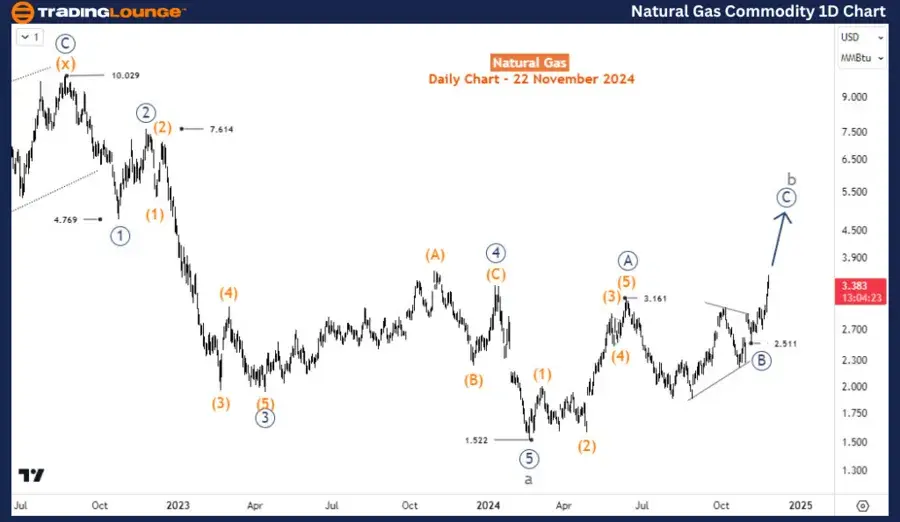
Daily chart analysis

On the daily chart, the recovery from the 21 February low of 1.522 is correcting the entire 5-wave decline from 22 August, when the commodity traded for $10, to 21 February when it exchanged for barely $1.5. By Fibonacci projection, this recovery could extend to $3.9-5. The first leg of the correction, wave ((A)) finished with an impulse 5-wave structure at 3.16 on 11th June. The pullback that followed in wave ((B)) ended in a sideways triangle structure. Rally for wave ((C)) began at 2.51 and should extend higher while short-term buyers look for opportunities from pullbacks. Meanwhile, swing sellers can wait for the corrective cycle to finish before engaging.
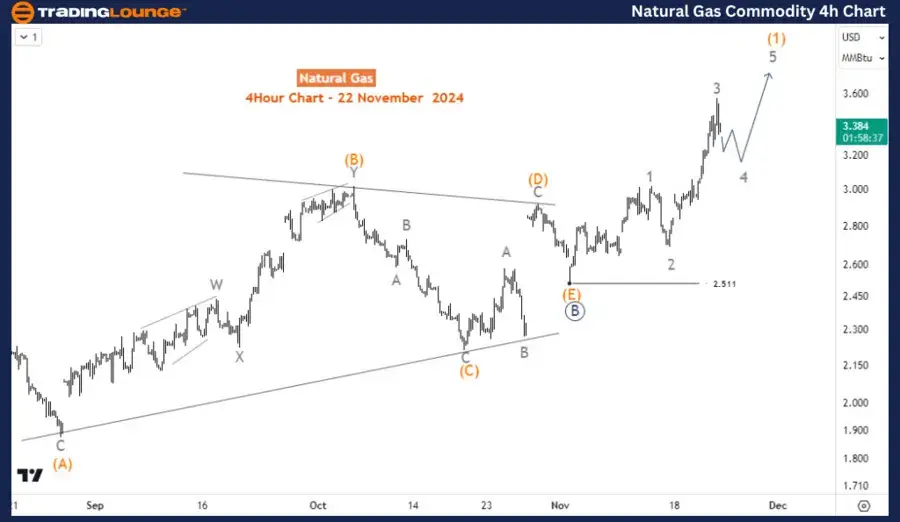
Chart

H4 chart analysis

On the H4 chart, wave (1) of ((C)) is emerging and appears incomplete. Price has probably completed wave 3 of (1) and is in a pullback for wave 4 of (1) where fresh bids will push the commodity’s prices higher. The best opportunity will be to look for a corrective pullback in wave (2) and find opportunities to the upside.

Chart

Technical analyst: Sanmi Adeagbo.

Natural Gas Elliott Wave analysis [Video]

Author

Peter Mathers

Peter Mathers

TradingLounge

Peter Mathers started actively trading in 1982. He began his career at Hoei and Shoin, a Japanese futures trading company.

More from Peter Mathers
Share:

Editor's Picks

EUR/USD hits two-day highs near 1.1820

EUR/USD picks up pace and reaches two-day tops around 1.1820 at the end of the week. The pair’s move higher comes on the back of renewed weakness in the US Dollar amid growing talk that the Fed could deliver an interest rate cut as early as March. On the docket, the flash US Consumer Sentiment improves to 57.3 in February.

GBP/USD reclaims 1.3600 and above

GBP/USD reverses two straight days of losses, surpassing the key 1.3600 yardstick on Friday. Cable’s rebound comes as the Greenback slips away from two-week highs in response to some profit-taking mood and speculation of Fed rate cuts. In addition, hawkish comments from the BoE’s Pill are also collaborating with the quid’s improvement.

Gold climbs further, focus is back to 45,000

Gold regains upside traction and surpasses the $4,900 mark per troy ounce at the end of the week, shifting its attention to the critical $5,000 region. The move reflects a shift in risk sentiment, driving flows back towards traditional safe haven assets and supporting the yellow metal.

Crypto Today: Bitcoin, Ethereum, XRP rebound amid risk-off, $2.6 billion liquidation wave

Bitcoin edges up above $65,000 at the time of writing on Friday, as dust from the recent macro-triggered sell-off settles. The leading altcoin, Ethereum, hovers above $1,900, but resistance at $2,000 caps the upside. Meanwhile, Ripple has recorded the largest intraday jump among the three assets, up over 10% to $1.35.

Three scenarios for Japanese Yen ahead of snap election

The latest polls point to a dominant win for the ruling bloc at the upcoming Japanese snap election. The larger Sanae Takaichi’s mandate, the more investors fear faster implementation of tax cuts and spending plans. 

XRP rally extends as modest ETF inflows support recovery

Ripple is accelerating its recovery, trading above $1.36 at the time of writing on Friday, as investors adjust their positions following a turbulent week in the broader crypto market. The remittance token is up over 21% from its intraday low of $1.12.