|

Natural Gas Elliott Wave technical analysis [Video]

Natural Gas Elliott Wave analysis

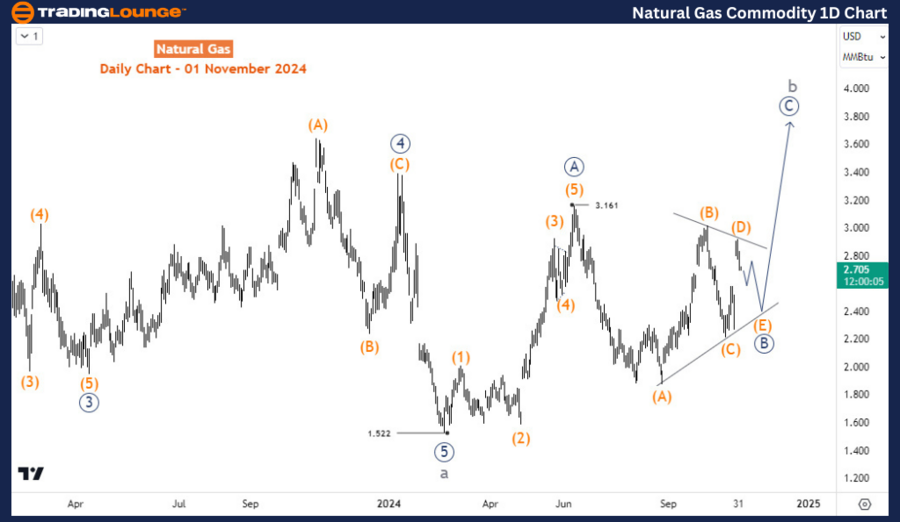
The late October recovery continues as the commodity has stayed within a sideways price structure since April 2023. Meanwhile, in the meantime, it appears prices will attempt to break the October and June highs of 2024 to retest the January 2024 and October 2023 highs of the range.

From the long-term price action, Natural gas completed the bearish impulse wave sequence from August 2022, when it exchanged for $10, in February 2024 at barely $1.5. That was a whooping crash! However, from the perspective of the Elliottwave theory, a 3-wave correction follows a 5-wave trend. It appears the price is correcting the bearish impulse from August 2022. The correction could advance as much as $4.79-5.8.

On the daily chart, the correction starts from 1.522 and is emerging into a zigzag structure of the primary degree. Wave ((A)) finished with an impulse structure at 3.16 in June 2024. Since June, the price fell and went sideways suggesting a triangle structure for wave ((B)). Thus, when wave ((B)) ends, wave ((C)) should advance to $4 or higher.

Chart

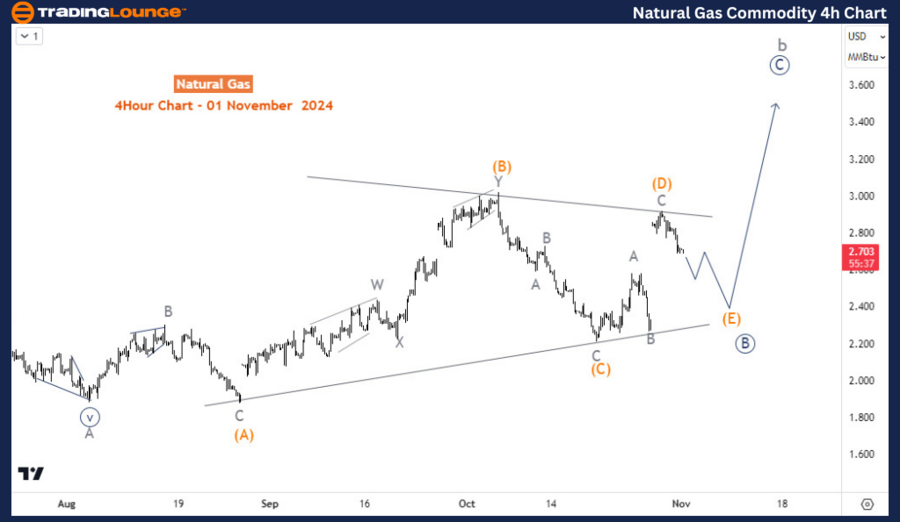
On the H4 chart, it appears wave (E) of ((B)) is incomplete. Thus, the pullback from late October could extend to 2.47 -2.35 to complete wave (E) and then price surges to continue the bullish correction that started on February.

Chart

Technical analyst: Sanmi Adeagbo.

Natural Gas Elliott Wave analysis [Video]

Author

Peter Mathers

Peter Mathers

TradingLounge

Peter Mathers started actively trading in 1982. He began his career at Hoei and Shoin, a Japanese futures trading company.

More from Peter Mathers
Share:

Markets move fast. We move first.

Orange Juice Newsletter brings you expert driven insights - not headlines. Every day on your inbox.

By subscribing you agree to our Terms and conditions.

Editor's Picks

EUR/USD flatlines below 1.1800 ahead of Fed Minutes

EUR/USD struggles to find direction and continues to move sideways below 1.1800 for the second consecutive day on Tuesday as markets remain in holiday mood. Later in the American session, the Federal Reserve will publish the minutes of the December policy meeting.

GBP/USD retreats to 1.3500 area following earlier climb

GBP/USD loses its traction and trades flat on the day near 1.3500 after rising to the 1.3530 area early Tuesday. Trading conditions remain thin ahead of the New Year holiday, limiting the pair's volatility. The Fed will publish December meeting minutes in the late American session.

Gold aims to regain the ground lost

Gold gathers recovery momentum and advances toward $4,400 on Tuesday after losing more than 4% on Monday. Increased margin requirements on gold and silver futures by the Chicago Mercantile Exchange Group, one of the world’s largest trading floors for commodities, prompted widespread profit-taking and portfolio rebalancing.

Tron steadies as Justin Sun invests $18 million in Tron Inc.

Tron (TRX) trades above $0.2800 at press time on Monday, hovering below the 50-day Exponential Moving Average (EMA) at $0.2859.

Economic outlook 2026-2027 in advanced countries: Solidity test

After a year marked by global economic resilience and ending on a note of optimism, 2026 looks promising and could be a year of solid economic performance. In our baseline scenario, we expect most of the supportive factors at work in 2025 to continue to play a role in 2026.

Crypto market outlook for 2026

Year 2025 was volatile, as crypto often is.  Among positive catalysts were favourable regulatory changes in the U.S., rise of Digital Asset Treasuries (DAT), adoption of AI and tokenization of Real-World-Assets (RWA).