|

Natural Gas Elliott Wave technical analysis [Video]

Natural Gas Elliott Wave analysis

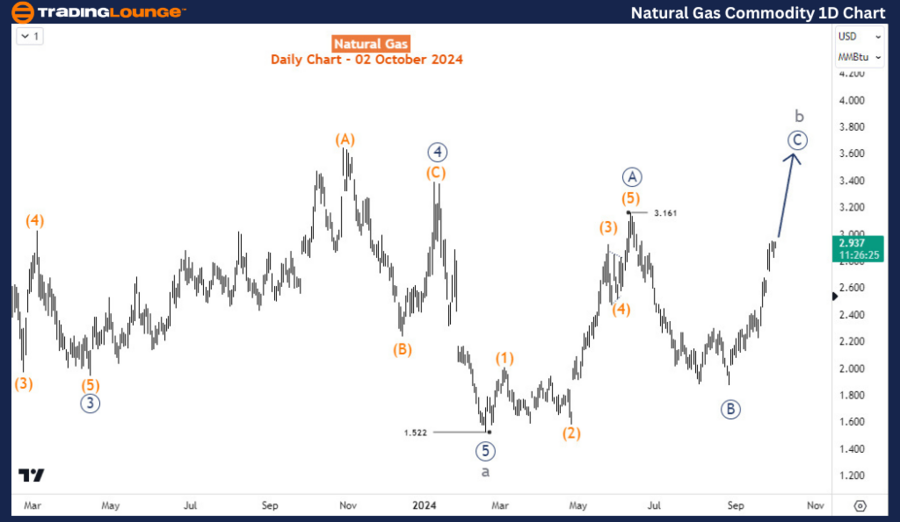
Natural Gas is recovering fast from the low in late August. The commodity is near the highs of June & January 2024 and the late October 2023 high and will most likely hit or breach these highs in the coming weeks. However, this bullish run from October 2023 is part of the larger bullish correction from the February 2024 low. Thus, while the bullish correction persists, short-term traders can continue to buy from the low of pullbacks until it reaches the 2.65-3.37 zone which can act as a resistance.

On the daily chart, the price is correcting the impulse wave bearish run from the high of August 2022 when the commodity traded for around $10. This impulse structure has been labeled as wave a of the cycle degree. From 1.522 where cycle degree wave a, the corresponding wave began. Wave b cycle degree is expected to be a corrective structure. Price has already completed primary degree waves A & B (circled) of c in June and August 2024 respectively. From the August low, primary degree wave C (circled) of b emerges into an impulse structure. By projection, wave C (circled) could extend as much as 3.53 and even higher to 4.17. With this potential, short-term traders can continue to buy pullbacks on the hourly charts.

Chart

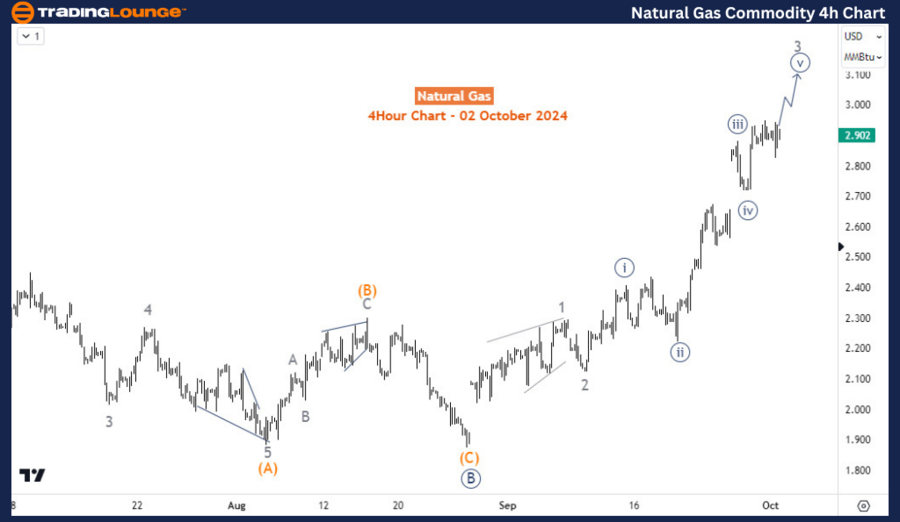
The H4 chart shows the sub-waves of C (circled) and how far it’s gone. Price is currently in wave 5 of (3) of C (circled). The next pullback will be for wave (4) and if it’s corrective, could be an opportunity to buy from the dip again.

Chart

Technical analyst: Sanmi Adeagbo.

Natural Gas Elliott Wave analysis [Video]

Author

Peter Mathers

Peter Mathers

TradingLounge

Peter Mathers started actively trading in 1982. He began his career at Hoei and Shoin, a Japanese futures trading company.

More from Peter Mathers
Share:

Editor's Picks

EUR/USD hits two-day highs near 1.1820

EUR/USD picks up pace and reaches two-day tops around 1.1820 at the end of the week. The pair’s move higher comes on the back of renewed weakness in the US Dollar amid growing talk that the Fed could deliver an interest rate cut as early as March. On the docket, the flash US Consumer Sentiment improves to 57.3 in February.

GBP/USD reclaims 1.3600 and above

GBP/USD reverses two straight days of losses, surpassing the key 1.3600 yardstick on Friday. Cable’s rebound comes as the Greenback slips away from two-week highs in response to some profit-taking mood and speculation of Fed rate cuts. In addition, hawkish comments from the BoE’s Pill are also collaborating with the quid’s improvement.

Gold climbs further, focus is back to 45,000

Gold regains upside traction and surpasses the $4,900 mark per troy ounce at the end of the week, shifting its attention to the critical $5,000 region. The move reflects a shift in risk sentiment, driving flows back towards traditional safe haven assets and supporting the yellow metal.

Crypto Today: Bitcoin, Ethereum, XRP rebound amid risk-off, $2.6 billion liquidation wave

Bitcoin edges up above $65,000 at the time of writing on Friday, as dust from the recent macro-triggered sell-off settles. The leading altcoin, Ethereum, hovers above $1,900, but resistance at $2,000 caps the upside. Meanwhile, Ripple has recorded the largest intraday jump among the three assets, up over 10% to $1.35.

Three scenarios for Japanese Yen ahead of snap election

The latest polls point to a dominant win for the ruling bloc at the upcoming Japanese snap election. The larger Sanae Takaichi’s mandate, the more investors fear faster implementation of tax cuts and spending plans. 

XRP rally extends as modest ETF inflows support recovery

Ripple is accelerating its recovery, trading above $1.36 at the time of writing on Friday, as investors adjust their positions following a turbulent week in the broader crypto market. The remittance token is up over 21% from its intraday low of $1.12.