Natural Gas Elliott Wave technical analysis [Video]
![Natural Gas Elliott Wave technical analysis [Video]](https://editorial.fxstreet.com/images/Markets/Commodities/Energy/Gas/refinery-15319728_XtraLarge.jpg)
Natural Gas Elliott Wave analysis
Natural Gas is currently recovering from its August 2024 low, but technical indicators suggest that the commodity may soon face resistance, continuing the bearish trend from its June 2024 high. This analysis will provide insights from an Elliott Wave perspective, detailing the potential for further downside and the key levels to watch in the coming weeks.
Long-term chart analysis
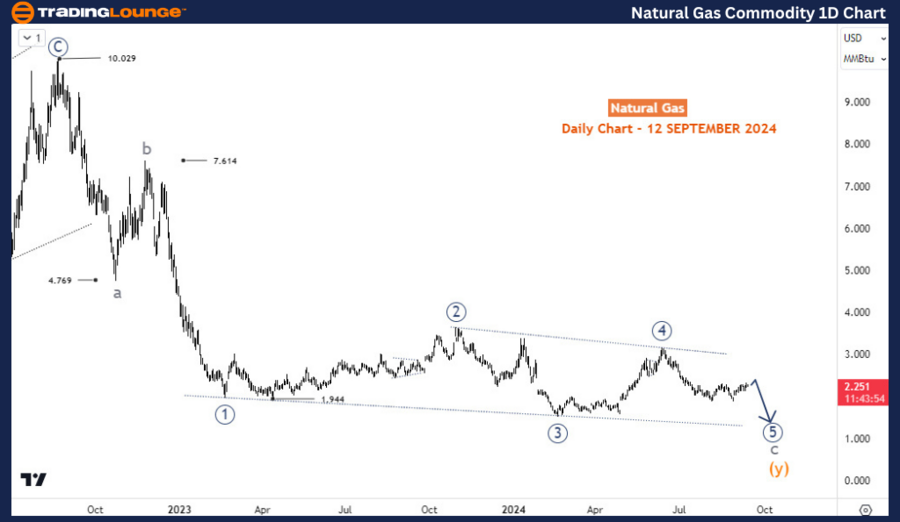
On the daily chart, Natural Gas has been in a long-term downtrend since reaching a peak near $10 in August 2022. This downtrend is unfolding as a corrective a-b-c pattern of the cycle degree. The first leg of this correction, labeled wave a, completed around the $4.77 level. Following that, the market rallied in wave b, which topped out near $7.61.
Since November 2022, Natural Gas has been in the final leg of this corrective structure, progressing within an ending diagonal pattern in wave c. Ending diagonals typically indicate the final phase of a larger correction, suggesting that this bearish move may be nearing its conclusion. However, the market still has further downside potential before a major bottom is in place.
The current phase of this correction is the fifth and final leg of the ending diagonal, labeled wave 5 (circled). This leg is unfolding as a three-wave structure and is expected to break below the previous low of wave 3 (circled), which was at 1.524. Once wave 5 (circled) completes, the entire a-b-c corrective pattern should also conclude, potentially signaling the end of the long-term downtrend. A significant reversal could then follow, setting the stage for a longer-term bullish phase.
Daily chart analysis
The daily chart confirms that Natural Gas is currently in the 5th wave of the diagonal pattern, and this leg appears to be developing in a three-wave structure. The market is likely to experience further downside pressure, especially as it approaches and breaks below the 1.524 low from wave 3 (circled). A continuation of this bearish momentum could result in the final leg of wave 5 (circled), completing the larger correction.
H4 chart analysis
Zooming into the H4 chart, we see more detailed insights into the recent price action. Wave (A) of the current decline completed as an impulse sequence at 1.88 in early August 2024, marking the first leg of the larger move down. This was followed by a corrective bounce in wave (B), which appears to have formed an irregular flat pattern. Wave A of this flat correction finished on August 15, 2024, and wave B then broke below the starting price of wave A before ending at the August 2024 low.
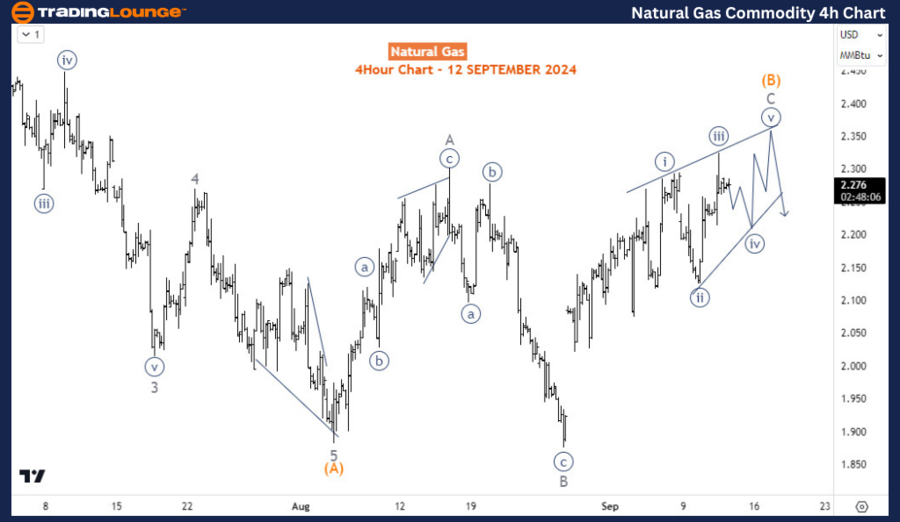
Wave C of (B) is now developing, but the price action remains choppy, especially near the top. Given the structure of the wave, the most probable outcome is an ending diagonal pattern for wave C. However, the structure remains somewhat unclear, and it would be prudent to wait for a break below the low of wave B to confirm the resumption of the bearish trend.
Once wave C of (B) completes, the market is expected to resume its downward move, continuing the larger bearish sequence that began in June 2024. The break of wave B’s low will be a key signal that bearish dominance has returned and that the final leg of the ending diagonal in wave 5 (circled) is underway.
Conclusion
Natural Gas is currently in the final phase of a long-term corrective pattern, with further downside expected before the trend reverses. The Elliott Wave structure suggests that wave 5 (circled) of the ongoing diagonal pattern is still in progress, and a break below 1.524 is likely in the near future. On the H4 chart, the structure remains tricky, but once the low of wave B is breached, the bearish trend should resume with force. Traders should remain cautious but prepare for a potential buying opportunity once the final leg of this correction completes.
Technical analyst: Sanmi Adeagbo.
Natural Gas Elliott Wave analysis [Video]
Author

Peter Mathers
TradingLounge
Peter Mathers started actively trading in 1982. He began his career at Hoei and Shoin, a Japanese futures trading company.


