Natural Gas Elliott Wave analysis: A deeper decline expected

Natural Gas saw a brief recovery in early August but is now showing signs of continuing its downtrend, with the potential to reach new August lows. The ongoing decline, which began in June 2024, is likely to extend toward the Q1 2024 low between 1.5 and 1.6. If this trend plays out, Natural Gas could reach its lowest levels since September 2020.

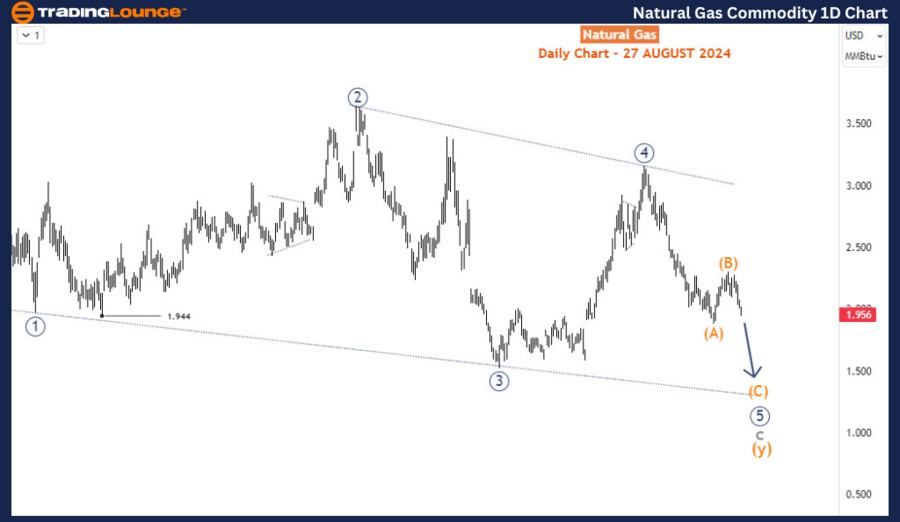
Daily chart analysis

On the daily chart, the long-term downtrend from the $10 peak in August 2022 is unfolding as a corrective pattern labeled as waves a-b-c of the cycle degree. Wave a completed around 4.77, followed by a wave b rally that ended near 7.61. Since November 2022, wave c has been progressing within an ending diagonal pattern, which typically signals the final phase of a corrective structure.

Currently, the market is in the 5th leg (wave 5, circled) of this diagonal pattern. This leg is developing as a three-wave structure and is expected to break below the previous low of wave 3 (circled) at 1.524, suggesting further downside. The anticipated continuation of wave 5 (circled) is likely to form another three-wave move, ultimately completing the larger corrective pattern. Once this structure is finalized, a significant bottom could be in place, potentially leading to a longer-term reversal.

GAS

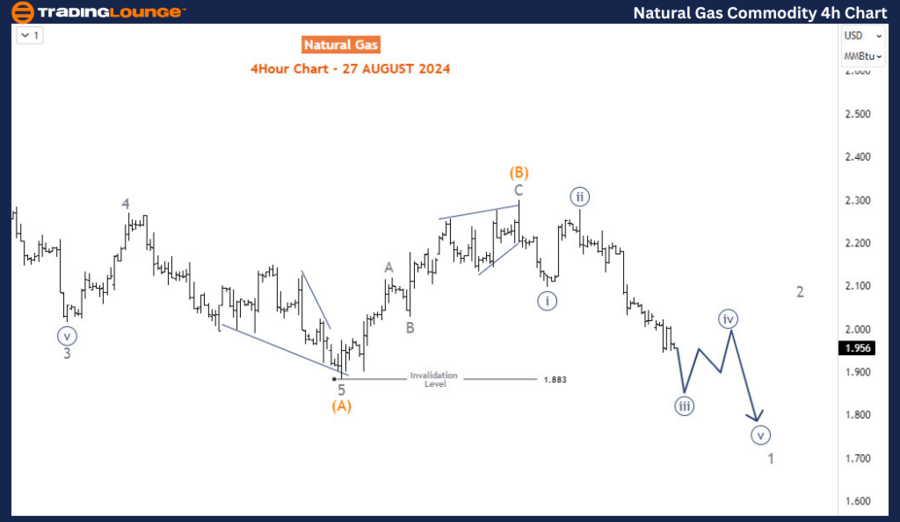
Four-hour chart analysis

The H4 chart provides a closer view of the recent market developments. Wave (A) completed as an impulse sequence at 1.88 in early August 2024, marking the first leg of the current decline. Afterward, wave (B) emerged, ending on August 15th with a shallow retracement. Although wave (B) could extend into a double zigzag rally if support holds above 1.883, the overall bias remains bearish.

The decline from the August 15th high is evolving into an impulsive move, increasing the likelihood of a breach below 1.883. Once this support level breaks, wave (C) is expected to continue the decline, targeting levels below 1.5. Traders should watch for corrective bounces during this phase as potential selling opportunities, aligning with the broader bearish trend.

In summary, Natural Gas remains under pressure, with the technical structure suggesting further downside. The focus should be on selling rallies as the market approaches key support levels, aiming for a potential bottom in the 1.5 to 1.6 region.

GAS

Natural Gas Elliott Wave technical analysis [Video]

As with any investment opportunity there is a risk of making losses on investments that Trading Lounge expresses opinions on.

Historical results are no guarantee of future returns. Some investments are inherently riskier than others. At worst, you could lose your entire investment. TradingLounge™ uses a range of technical analysis tools, software and basic fundamental analysis as well as economic forecasts aimed at minimizing the potential for loss.

The advice we provide through our TradingLounge™ websites and our TradingLounge™ Membership has been prepared without considering your objectives, financial situation or needs. Reliance on such advice, information or data is at your own risk. The decision to trade and the method of trading is for you alone to decide. This information is of a general nature only, so you should, before acting upon any of the information or advice provided by us, consider the appropriateness of the advice considering your own objectives, financial situation or needs. Therefore, you should consult your financial advisor or accountant to determine whether trading in securities and derivatives products is appropriate for you considering your financial circumstances.

Recommended Content


Recommended Content

Editors’ Picks

EUR/USD stays in tight range below 1.1200 after US data

EUR/USD stays in tight range below 1.1200 after US data

EUR/USD continues to fluctuate in a narrow band below 1.1200 in the second half of the day on Tuesday. The bearish opening in Wall Street and the upbeat consumer sentiment data from the US support the USD, limiting the pair's upside.

EUR/USD News
GBP/USD clings to daily gains above 1.3200

GBP/USD clings to daily gains above 1.3200

GBP/USD trades in positive territory above 1.3200 in the American session on Tuesday. The USD benefits from the cautious market mood and better-than-expected CB Consumer Confidence data, capping the pair's gains.

GBP/USD News
Gold holds comfortably above $2,500 despite rising US yields

Gold holds comfortably above $2,500 despite rising US yields

Gold holds steady above $2,500 in the second half of the day on Tuesday. The benchmark 10-year US Treasury bond yield gains 1% above 3.8% after upbeat US data, making it difficult for XAU/USD to gather bullish momentum.

Gold News
Markets in a waiting pattern with a potential explosion in volatility – Why?

Markets in a waiting pattern with a potential explosion in volatility – Why?

The weakness of the Dollar tok a breezer but might continue these coming days. il prices steadied further after the strong support level holds the price from falling further. Geopolitical tensions and the end of the month might call for more upside potential here.

Read more
Three fundamentals for the week: Focus on the fragility of the US economy

Three fundamentals for the week: Focus on the fragility of the US economy Premium

US Consumer confidence data will provide a gauge of how consumers are feeling. Jobless claims are in focus after Fed Chair Powell's dovish speech. Investors will look to the core PCE index to confirm that inflation is falling.

Read more
Moneta Markets review 2024: All you need to know

Moneta Markets review 2024: All you need to know

VERIFIED In this review, the FXStreet team provides an independent and thorough analysis based on direct testing and real experiences with Moneta Markets – an excellent broker for novice to intermediate forex traders who want to broaden their knowledge base.

Read More

Majors

Cryptocurrencies

Signatures