Natural Gas Elliott Wave analysis

Natural gas is currently experiencing a recovery after a significant bearish trend in 2024. However, this downtrend is expected to intensify in the coming weeks. Following a strong rebound from the February 2024 low, natural gas has retraced more than two-thirds of those gains, signaling a possible revisit to the 2020 lows. The broader trend has been downward since August 2022, and although a short-term recovery began on August 5th, it is likely to be temporary. Sellers may regain control later in the month or by early September.

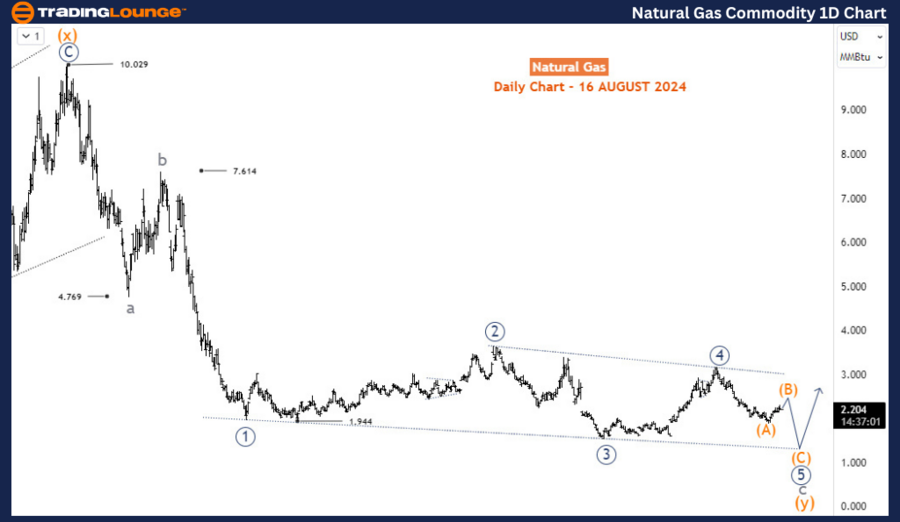
Daily chart analysis

On the daily chart, the decline from the $10 high in August 2022 is developing as a corrective pattern, labeled as waves a-b-c of the cycle degree. Wave a concluded near 4.77, followed by wave b, which ended around 7.61. Since November 2022, wave c has been unfolding as an ending diagonal pattern. Currently, the 5th leg (wave 5, circled) within this diagonal is in progress, and it is expected to continue downward in a three-wave structure. This movement is likely to break below the 3rd wave low (wave 3, circled) at 1.524, suggesting further downside before the pattern completes. The 5th wave (circled) of c of (y) is anticipated to develop into a three-wave structure, which is more evident on the H4 chart.
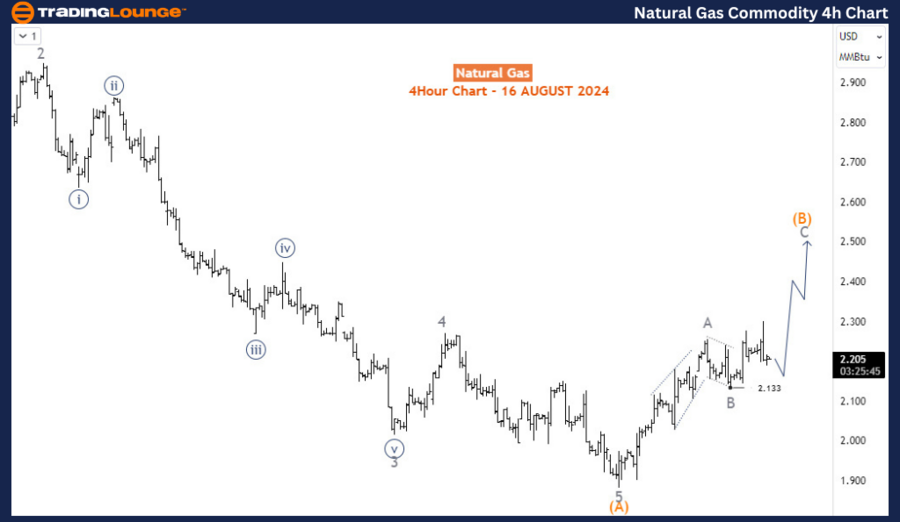
Chart


H4 chart analysis

On the H4 chart, the price has completed wave (A) of 5 (circled) and is currently correcting upward in wave (B). Once wave (B) is complete, the price is expected to resume its decline in wave (C). However, wave (B) has not yet finished, so in the near term, the commodity is favoring an upside move.

Chart


Conclusion

Natural gas is in a complex corrective phase, with potential short-term gains likely to give way to a continuation of the broader downtrend. The Elliott Wave analysis suggests that while there may be brief rallies, the overall outlook remains bearish, with further declines anticipated once the current corrective wave (B) is complete. Traders should be cautious of the temporary recovery and prepare for potential downside movement as the broader bearish trend reasserts itself.

Technical analyst: Sanmi Adeagbo.

Natural Gas Elliott Wave Analysis [Video]

As with any investment opportunity there is a risk of making losses on investments that Trading Lounge expresses opinions on.

Historical results are no guarantee of future returns. Some investments are inherently riskier than others. At worst, you could lose your entire investment. TradingLounge™ uses a range of technical analysis tools, software and basic fundamental analysis as well as economic forecasts aimed at minimizing the potential for loss.

The advice we provide through our TradingLounge™ websites and our TradingLounge™ Membership has been prepared without considering your objectives, financial situation or needs. Reliance on such advice, information or data is at your own risk. The decision to trade and the method of trading is for you alone to decide. This information is of a general nature only, so you should, before acting upon any of the information or advice provided by us, consider the appropriateness of the advice considering your own objectives, financial situation or needs. Therefore, you should consult your financial advisor or accountant to determine whether trading in securities and derivatives products is appropriate for you considering your financial circumstances.

Recommended Content


Recommended Content

Editors’ Picks

EUR/USD stays in positive territory near 1.1000, looks to post weekly gains

EUR/USD stays in positive territory near 1.1000, looks to post weekly gains

EUR/USD trades modestly higher on the day at around 1.1000 in the American session on Friday. Although the cautious market stance limits the upside, the pair remains on track to post its highest weekly close of 2024.

EUR/USD News

GBP/USD climbs to multi-week highs above 1.2900

GBP/USD climbs to multi-week highs above 1.2900

GBP/USD trades at its highest level in three weeks at around 1.2900 in the American session on Friday. The bearish opening seen in Wall Street points to a negative tilt in risk mood and makes it difficult for the pair to gather further bullish momentum. 

GBP/USD News

Gold retreats after setting a new record high of $2,500

Gold retreats after setting a new record high of $2,500

Gold stages a technical correction and trades below $2,490 after setting a new record high of $2,500 earlier in the day, boosted by falling US Treasury bond yields. Profit-taking could ramp up the volatility heading into the weekend. 

Gold News

Dogecoin price is set for a downturn as it encounters its resistance barrier

Dogecoin price is set for a downturn as it encounters its resistance barrier

Dogecoin price is testing the resistance around the 100-day EMA at $0.1073, with an impending decline ahead. On-chain data shows DOGE's daily active addresses decreasing and dormant wallets moving again, signaling a bearish move.

Read more

Easing inflation worries despite robust sales data

Easing inflation worries despite robust sales data

The market mood got a further boost yesterday after the latest data release from he US hinted that the economy is not doing that bad, after all. 

Read more

Majors

Cryptocurrencies

Signatures