Natural Gas Elliott Wave technical analysis [Video]
![Natural Gas Elliott Wave technical analysis [Video]](https://editorial.fxstreet.com/images/Markets/Commodities/Energy/Gas/pipeline-18754412_XtraLarge.jpg)
Natural Gas commodity Elliott Wave technical analysis
Mode - Larger degree bullish correction.
Structure - Impulse wave C (circled) of Flat.
Position - Wave (4).
Direction - Wave (5).
Details: No confirmation above 2.953 yet. Thus, we shouldn't write off wave (4) extending lower. A break above 2.953 will confirm wave (5) is in progress. Until then, wave (4) could reach close to 2.5.
Since late February 2024, natural gas prices have rebounded over 70% after hitting their lowest level since mid-2020. The commodity appears poised to continue higher, potentially reaching new highs not seen since 2023. However, in the long term, this recovery could be part of a retracement of the bearish trend that began in October 2022, when prices were around $10. In the near term, the pullback from June 11, 2024, is not far from completion. After the pullback, prices should resume their upward trajectory, continuing the recovery from February 2024.
Daily chart analysis
On the daily chart, natural gas prices experienced a significant bearish impulse wave that started at $10.029 in August 2022 and completed at $1.944 in April 2023. Following a bearish impulse, a bullish correction typically ensues, and this is what the current price action represents. The emerging pattern appears to be an irregular flat correction. Wave A of this pattern concluded at $3.666, and wave B ended at $1.524. The price is now advancing in an impulse structure corresponding to wave C (circled) of the irregular flat correction. Wave C (circled) might terminate near the previous high of $3.666 or possibly breach it.
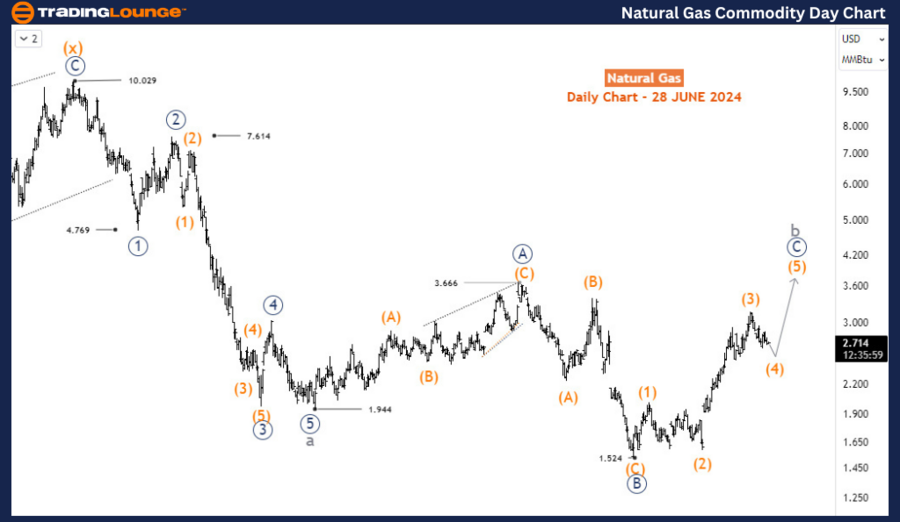
The impulse structure that began at $1.524 is critical in determining the completion point of the corrective phase that started from $1.944. Currently, this impulse wave is undergoing a corrective phase in wave (4), which is expected to be a temporary setback before the resumption of the upward trend.
H4 chart analysis
On the H4 chart, the impulse wave C (circled) has completed the first three sub-waves, identified as waves (1), (2), and (3) of the intermediate degree. Wave (4) is now emerging downwards and is expected to form a zigzag structure. This corrective wave (4) has completed waves A and B, and wave C of (4) is currently unfolding downwards. The decline in wave C of (4) could continue to the $2.56 - $2.44 Fibonacci retracement zone before prices turn upward again.
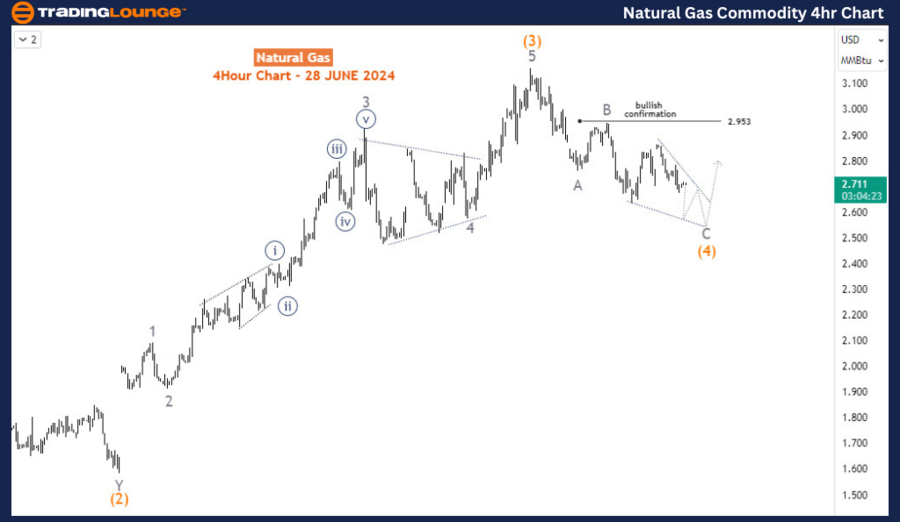
This anticipated upward movement will likely mark the beginning of wave (5), continuing the year-long bullish trend. If the price resumes its upward movement from the Fibonacci support zone, it could reach or even surpass the previous high of $3.666, confirming the continuation of the bullish trend initiated in February 2024. The completion of wave (5) should provide a clear signal that the corrective phase from April 2023 has ended, setting the stage for further gains in the commodity.
Technical analyst: Sanmi Adeagbo.
Natural Gas commodity Elliott Wave technical analysis [Video]
Author

Peter Mathers
TradingLounge
Peter Mathers started actively trading in 1982. He began his career at Hoei and Shoin, a Japanese futures trading company.


