Natural Gas Elliott Wave technical analysis [Video]
![Natural Gas Elliott Wave technical analysis [Video]](https://editorial.fxstreet.com/images/Markets/Commodities/Energy/Gas/refinery-15319728_XtraLarge.jpg)
Natural Gas technical analysis
Mode: Larger degree bullish correction.
Structure: Impulse wave C (circled) of Flat.
Position: Wave 4.
Direction: Wave 5.
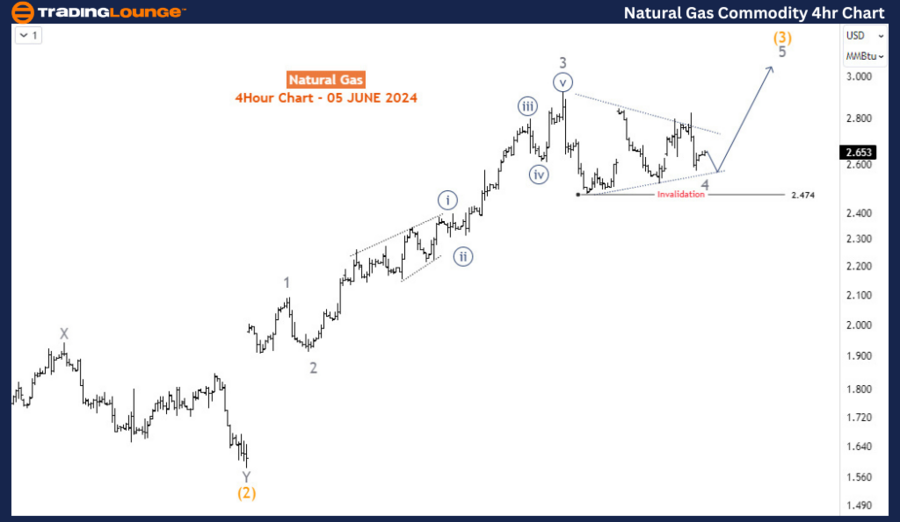
Details: Price remains sideways above 2.474 in wave 4 awaiting a confirmation break upside to confirm wave 5 emergence. The invalidation level remains above 2.474. Same interpretation as the previous update.
Since it bounced from the yearly low in February, Natural Gas (NG) has been on a steady upward trajectory as it approaches the high for 2024. There is a strong likelihood that this rally will continue, potentially reaching new highs for the year and even surpassing the November 2023 peak.
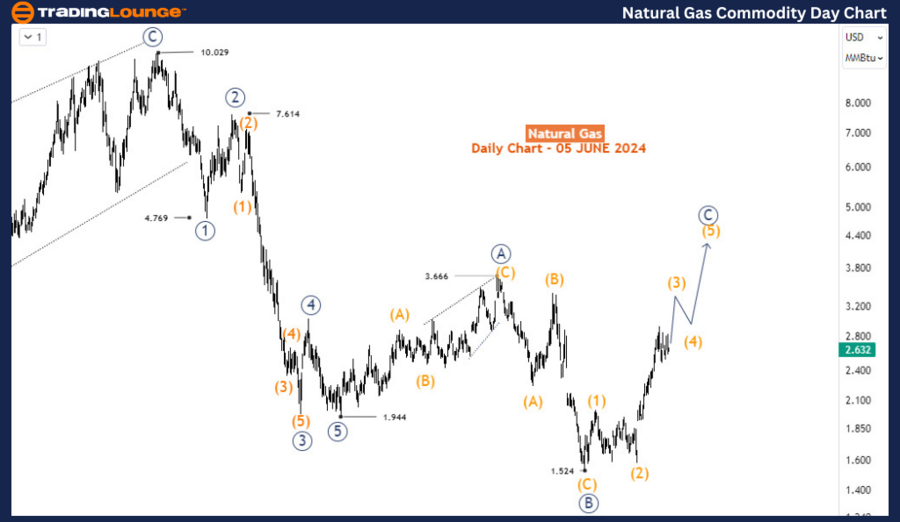
On the daily chart, we see that Natural Gas completed a bearish impulse wave from nearly $10 in August 2022 to $1.944 in April 2023. According to Elliott Wave Theory, after a five-wave impulse completes, the price typically retraces with a three-wave corrective structure. This has been evident since the conclusion of the impulse wave decline. The bullish corrective structure emerging from 1.944 appears to be forming one of the irregular flat patterns—either an expanding flat or a running flat. The first leg, primary wave A (circled), completed at 3.666 with a three-wave structure. The corresponding wave B (circled) also completed with a three-wave structure at 1.52. The third and final leg, circled wave C, is expected to be an impulse wave and is currently progressing in wave (3). Wave (3) does not appear to be complete, suggesting the impulse could extend above 3.666 in the coming weeks.
On the H4 chart, wave (3) is developing into an impulse wave as expected. The price is currently completing wave 4 of (3) with a contracting triangle sideways structure. If the price remains above 2.474 and breaks above the upper boundary of the triangle, we should see a continuation of the rally for wave 5, which will complete wave (3) before the next pullback for wave (4) begins. Conversely, if the price breaches 2.474, traders should consider a zigzag structure for wave 4. This would still support further rallies, provided the price stays above 2.092.
In summary, Natural Gas has been rallying strongly since bouncing from its February low, with the potential to reach new highs for 2024. The daily chart indicates that after completing a significant bearish impulse wave, the price is now in a corrective phase, potentially forming an irregular flat pattern. The current wave (3) is still in progress and could extend beyond 3.666. The H4 chart supports this view, showing a contracting triangle pattern for wave 4 of (3). The critical levels to watch are 2.474 and 2.092; a break above the triangle's upper boundary would signal further rallies, while a breach below 2.474 could indicate a more complex wave 4 correction, still supporting the overall bullish trend as long as prices remain above 2.092. Traders should monitor these key levels and patterns to align their strategies with the ongoing market dynamics.
Natural Gas Elliott Wave technical analysis [Video]
Author

Peter Mathers
TradingLounge
Peter Mathers started actively trading in 1982. He began his career at Hoei and Shoin, a Japanese futures trading company.


