Natural Gas Elliott Wave technical analysis [Video]
![Natural Gas Elliott Wave technical analysis [Video]](https://editorial.fxstreet.com/images/Markets/Commodities/Energy/Gas/pipeline-18754412_XtraLarge.jpg)
Natural Gas technical analysis
Mode: Corrective for wave 4.
Structure: Double Zigzag.
Position: Wave (2).
Direction: Wave (3)).
Details: Wave (2) is close to completion in the reversal zone. Wave (3) will have begun if the price leaves the zone.
Natural Gas has embarked on a robust rally, surging nearly 45% since April 25, 2024, perpetuating the overarching bullish correction that commenced in January of the same year. Despite this upward momentum, the prevailing trend maintains a downward trajectory, seemingly unbroken as of yet. Consequently, traders anticipate the eventual resumption of the bearish trend after the culmination of the ongoing bullish retracement.
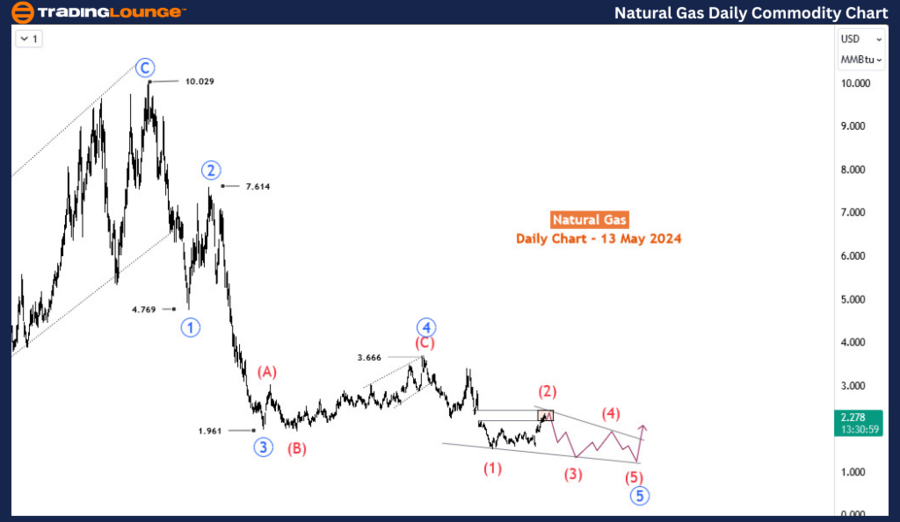
Analyzing the daily chart, a bearish impulse initiated in August 2022 around the $10 mark. From that point until February 2024, this downward cycle obliterated approximately 85% of the commodity's value, plummeting from $10 to a meager $1.52. However, the subsequent recovery from February exhibits characteristics indicative of a corrective pattern, potentially manifesting as either a zigzag or a double zigzag until a more formidable impetus materializes to warrant consideration of an impulse recovery.
Notably, around October 2023, the completion of the 4th wave within the long-term impulse was observed at 3.66, precipitating the onset of the 5th wave's descent. However, the price only finalized a 3-swing movement to the low of February 2024. When the initiation of the 5th wave commences with a 3-swing, it suggests a higher probability of an ending diagonal structure.
Delving into the daily chart analysis, we delineate the decline to the February low as wave (1) of the 5th wave, with the current upswing identified as wave (2). Presently, wave (2) has reached a reversal zone, signaling the potential commencement of wave (3). Alternatively, wave (2) might extend its upward trajectory in another three swings should the decline from the zone demonstrate corrective qualities. Monitoring the price action, it is imperative for wave (2) completion that the price conveniently remains below 3.39.
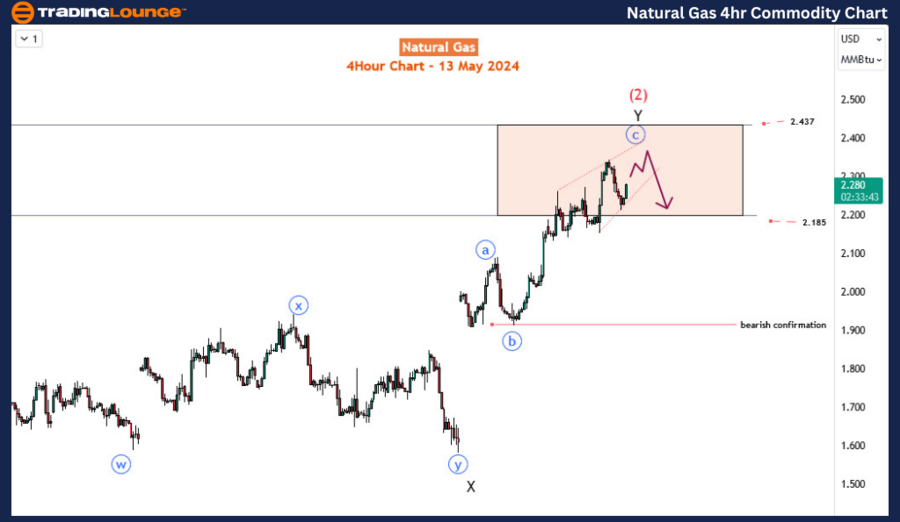
Zooming in on the H4 chart, wave (2) manifests as an evolving double zigzag pattern. Confirmation of wave (3) initiation necessitates the observation of a bearish impulse from the zone below 2.185, followed by a breach beneath the major level of 2.00. This juncture is poised to attract a surge in selling activity, propelling the commodity into a new low not witnessed in the past four years.
Natural Gas Elliott Wave technical analysis [Video]
Natural Gas Elliott Wave technical analysis [Video]
Author

Peter Mathers
TradingLounge
Peter Mathers started actively trading in 1982. He began his career at Hoei and Shoin, a Japanese futures trading company.


