Natural Gas Elliott Wave technical analysis [Video]
![Natural Gas Elliott Wave technical analysis [Video]](https://editorial.fxstreet.com/images/Markets/Commodities/Energy/Gas/storage-of-butane-gas-cylinders-12572315_XtraLarge.jpg)
Natural Gas Elliott Wave analysis - Prices approach key resistance zone
Function - Trend.
Mode - Impulsive.
Structure - Impulse Wave.
Position - Black wave 4 of red wave (3).
Direction - Black wave 5 of red wave (3).
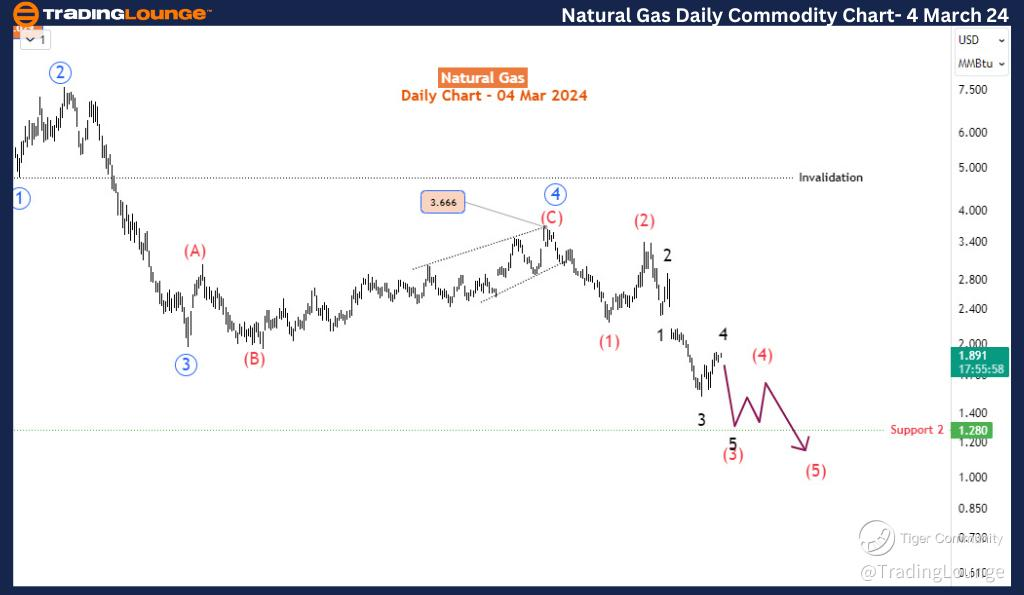
Natural Gas (NG) prices are approaching a significant resistance zone that could attract sellers in the coming days and weeks. Over the past two weeks, the commodity has been moving upward to correct the long-term bearish trend that began in August 2022 when it was trading at only $10. Unless there is a violation, this bearish trend should continue. The key question is where this correction will ultimately end - most likely at important price confluence zones shown on the charts.
Looking at the daily chart, the bearish trend is clear. The 4th wave (in blue) of the bearish impulse wave trend ended at 3.666. The 5th wave has already begun and is currently unfolding. Detailed analysis reveals that blue wave 5 is completing the red sub-wave (3). As expected, the red wave (3) is further dividing into an impulse wave, which is currently completing its 4th sub-wave represented by the black wave 4. Once wave 4 comes to an end, we can expect another downward movement for wave 5 of (3). Based on the daily chart, it appears that the decline in NG since 2022 is in its final stage and could reach its lowest point in the coming months. Meanwhile, by examining the H4 chart, we can understand how and where we can potentially participate in the next sell-off for wave 5 of (3).
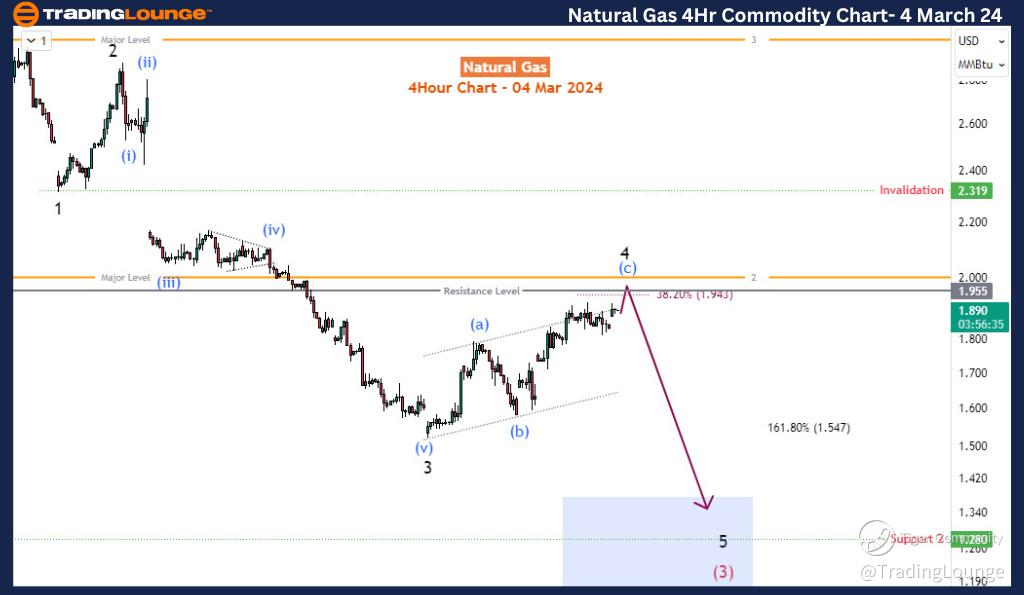
On the H4 chart, wave 4 subdivides into a 3-wave correction, specifically the blue wave (a)-(b)-(c). Interestingly, we have identified a confluence zone at 1.94-2, where a psychological level, a Fibonacci level, and a resistance level coincide, indicating the potential end of wave 4. The validity of the bearish impulse wave (3) will be in jeopardy if the price surpasses 2.32.
To summarize, according to the Elliott wave theory, the current bounce in NG is considered a corrective move within a bearish impulse wave. As the price approaches a crucial resistance zone, traders and investors can anticipate the sellers taking control once again and pushing the commodity towards 1.2.
Natural Gas daily chart
Natural Gas four hour chart
Natural Gas Elliott Wave analysis [Video]
Author

Peter Mathers
TradingLounge
Peter Mathers started actively trading in 1982. He began his career at Hoei and Shoin, a Japanese futures trading company.


