Natural Gas Elliott technical analysis [Video]
![Natural Gas Elliott technical analysis [Video]](https://editorial.fxstreet.com/images/Markets/Commodities/Energy/Gas/gas-pipeline-34545852_XtraLarge.jpg)
Natural Gas Elliott technical analysis
Mode - Larger degree bullish correction.
Structure - Diagonal for cycle degree wave c of the supercycle degree wave (y).
Position - Wave (A) on H4.
Direction - Wave (4) on H4 is still in play.
Details: Daily and H4 adjusted as the last view was violated. We are now counting a diagonal end for wave c of (y) to complete the decline from 10.029. On H4, wave 3 of (A) of 5 (circled) of c of (y) is close to completion.
The recent performance of natural gas signals a continued bearish trend. Natural gas has declined over 35% from its peak in June 2024 and is expected to drop further in the coming weeks. After a notable recovery from the February 2024 low, it has now retraced two-thirds of those gains, indicating a potential revisit to the lows of 2020. The broader trend shows a persistent downward movement since August 2022. Currently trading near $2, with a potential drop to $1.3 imminent, it’s crucial to identify where a significant upturn might occur, warranting caution for sellers.
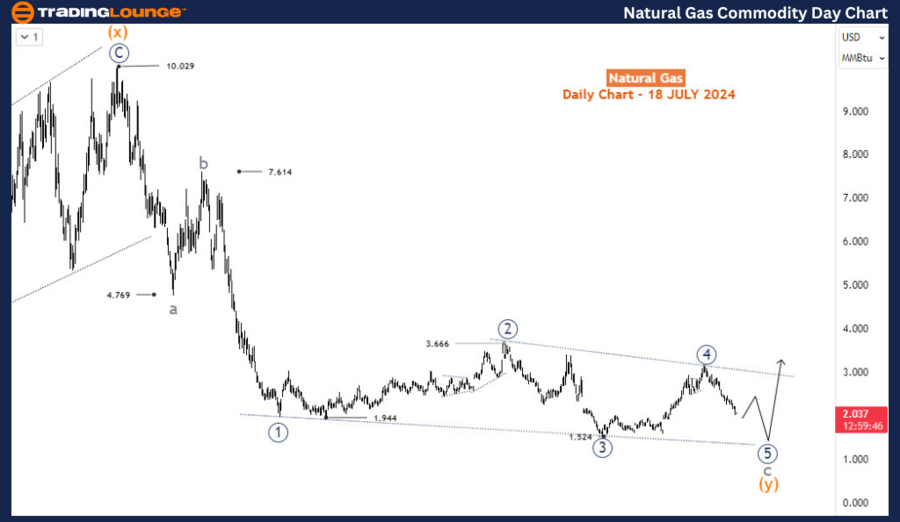
Daily chart analysis
On the daily chart, the decline from the $10 high in August 2022 is forming a corrective structure labeled as waves a-b-c of the cycle degree. Waves a and b concluded around 4.77 and 7.61, respectively. Since November 2022, wave c has been developing into an ending diagonal pattern. Within this diagonal, the 5th leg (wave 5, circled) is underway and is expected to continue lower in a three-wave structure, ultimately breaking below the low of the 3rd wave (wave 3, circled), which stands at 1.524. This ongoing decline suggests that prices could fall below 1.524 before the structure completes. At this juncture, sellers should exercise caution, as a significant trend reversal may occur, favoring the upside.
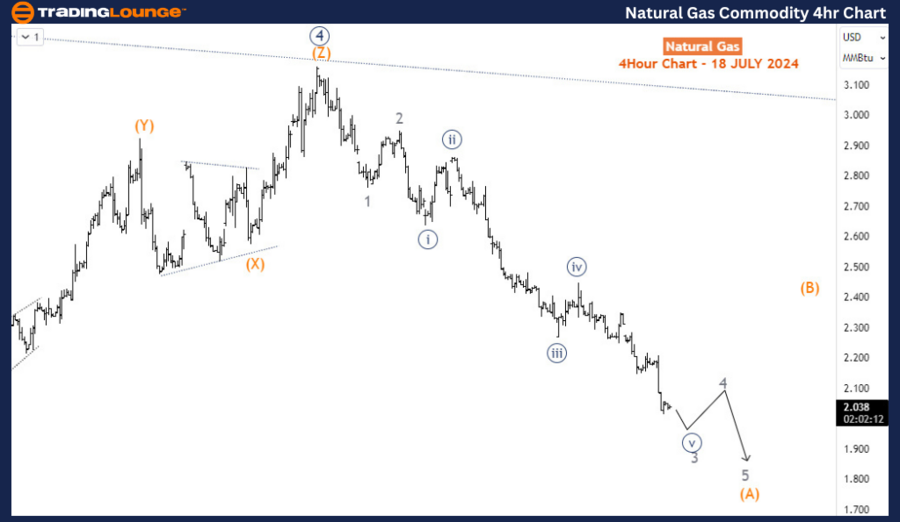
Four-hour chart analysis
The H4 chart provides a closer view of the sub-waves within this 5th wave. Currently, the price is in wave 3 of (A). Once wave (A) concludes, an upward correction in wave (B) is expected before the price resumes its downward trajectory for the final leg, wave (C). Sellers should look for fresh selling opportunities at the end of wave (B), as this corrective bounce provides a strategic entry point for further downside movement.
Summary
In summary, the Elliott Wave analysis of natural gas indicates a continuation of the current bearish trend, with the potential to reach as low as $1.3 in the near term. The completion of the ending diagonal pattern will be critical, as it could signal the end of the corrective cycle and the start of a significant bullish correction or reversal. Short-term traders should watch for wave (B) as a potential selling opportunity, while longer-term traders should be prepared for a possible trend reversal once the ending diagonal completes. This analysis highlights the importance of tracking wave structures and key price levels to anticipate future movements in the natural gas market.
Natural Gas Elliott technical analysis [Video]
Author

Peter Mathers
TradingLounge
Peter Mathers started actively trading in 1982. He began his career at Hoei and Shoin, a Japanese futures trading company.


