|

Natural Gas bouncing from Elliott Wave blue box area

In this technical blog, we will look at the past performance of the 1-hour Elliott Wave Charts of the Natural Gas futures ticker symbol: $NG_F. The rally from the 28 August 2024 low showed a higher high sequence & provided a short-term opportunity at the blue box area. In this case, the pullback managed to reach the Elliott wave blue box area & bounce higher. So, we advised members not to sell Natural Gas but to buy the blue box area for a minimum reaction higher to happen. We will explain the structure & forecast below:

Natural Gas one-hour Elliott Wave chart from 12.04.2024

Chart

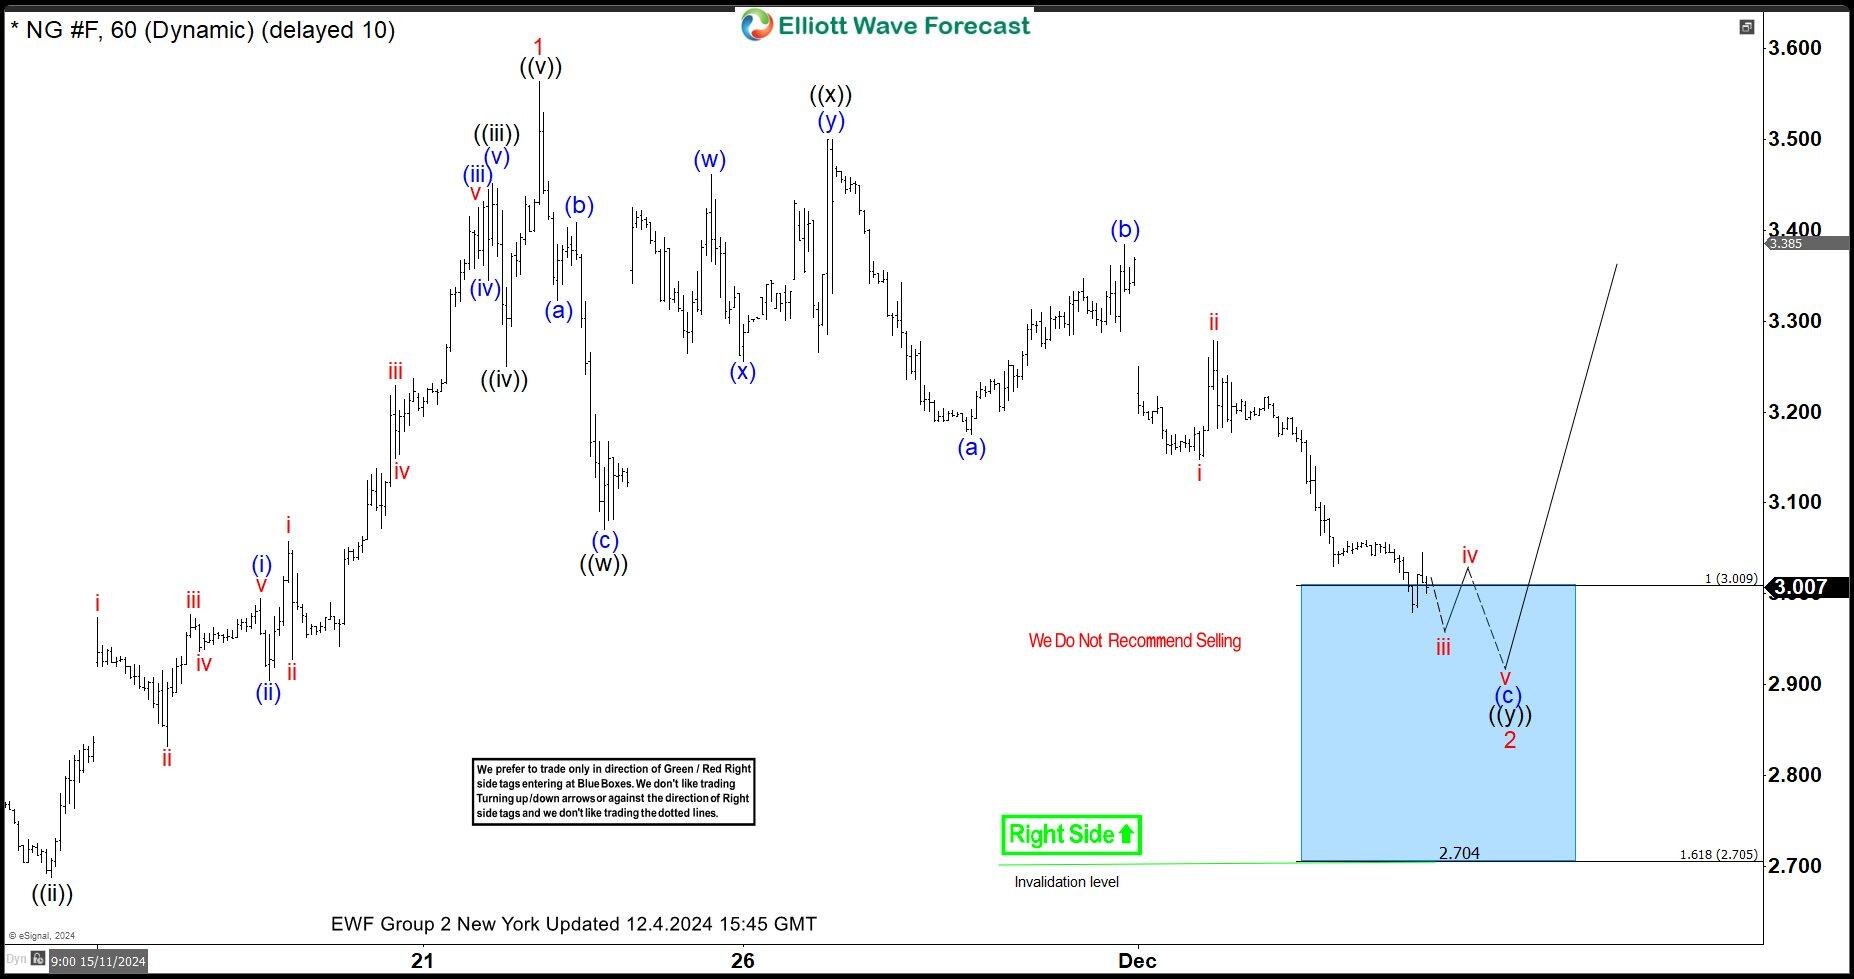
Here’s the 1-hour Elliott wave Chart from the 12.04.2024 New York update. In which, the rally to $3.563 high ended wave 1 & made a pullback in wave 2. The internals of that pullback unfolded as Elliott wave double three structure where wave ((w)) ended at $3.071 low.  A short-term bounce to $3.500 high then ended wave ((x)) & started the next leg lower in wave ((y)) towards $3.009- $2.705 equal legs area. From there, buyers were expected to appear looking for new highs ideally or for a 3-wave bounce minimum.

Natural Gas latest one-hour Elliott Wave chart from 12.10.2024

Chart

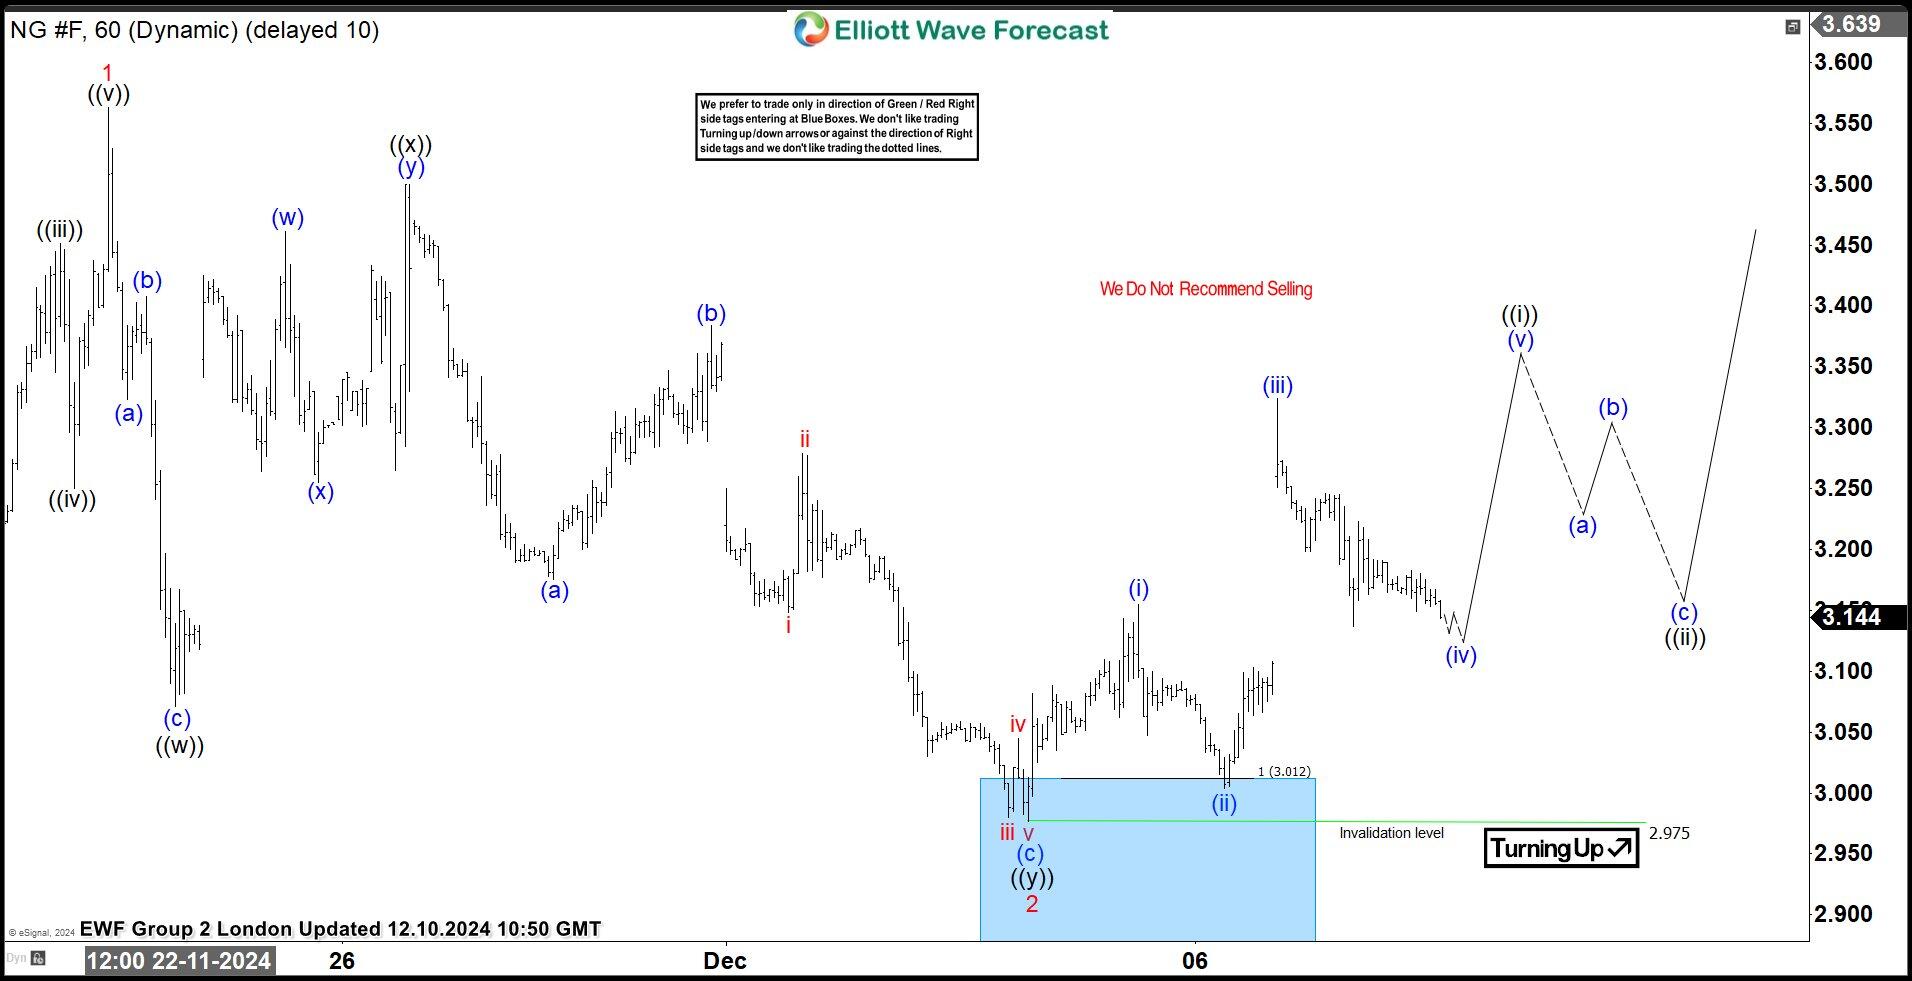
Above is the Latest 1-hour Elliott Wave Chart from the 12.10.2024 London update. In which the Natural Gas is showing a perfect reaction higher taking place from the equal legs area. Right after ending the double correction. Allowed members to create a risk-free position shortly after taking a long position. But a break above $3.563 high is needed to confirm the next leg higher minimum towards the $4.336- $4.658 area & avoid deeper correction lower.

Author

Elliott Wave Forecast Team

Elliott Wave Forecast Team

ElliottWave-Forecast.com

More from Elliott Wave Forecast Team
Share:

Editor's Picks

EUR/USD hovers around nine-day EMA above 1.1800

EUR/USD remains in the positive territory after registering modest gains in the previous session, trading around 1.1820 during the Asian hours on Monday. The 14-day Relative Strength Index momentum indicator at 54 is edging higher, signaling improving momentum. RSI near mid-50s keeps momentum balanced. A sustained push above 60 would firm bullish control.

GBP/USD holds medium-term bullish bias above 1.3600

The GBP/USD pair trades on a softer note around 1.3605 during the early European session on Monday. Growing expectation of the Bank of England’s interest-rate cut weighs on the Pound Sterling against the Greenback. 

Gold eyes acceptance above $5,000, kicking off a big week

Gold is consolidating the latest uptick at around the $5,000 mark, with buyers gathering pace for a sustained uptrend as a critical week kicks off. All eyes remain on the delayed Nonfarm Payrolls and Consumer Price Index data from the United States due on Wednesday and Friday, respectively.

Top Crypto Gainers: Aster, Decred, and Kaspa rise as selling pressure wanes

Altcoins such as Aster, Decred, and Kaspa are leading the broader cryptocurrency market recovery over the last 24 hours, as Bitcoin holds above $70,000 on Monday, up from the $60,000 dip on Thursday.

Weekly column: Saturn-Neptune and the end of the Dollar’s 15-year bull cycle

Tariffs are not only inflationary for a nation but also risk undermining the trust and credibility that go hand in hand with the responsibility of being the leading nation in the free world and controlling the world’s reserve currency.

Bitcoin, Ethereum and Ripple consolidate after massive sell-off

Bitcoin, Ethereum, and Ripple prices consolidated on Monday after correcting by nearly 9%, 8%, and 10% in the previous week, respectively. BTC is hovering around $70,000, while ETH and XRP are facing rejection at key levels. Traders should be cautious: despite recent stabilization, upside recovery for these top three cryptocurrencies is capped as the broader trend remains bearish.