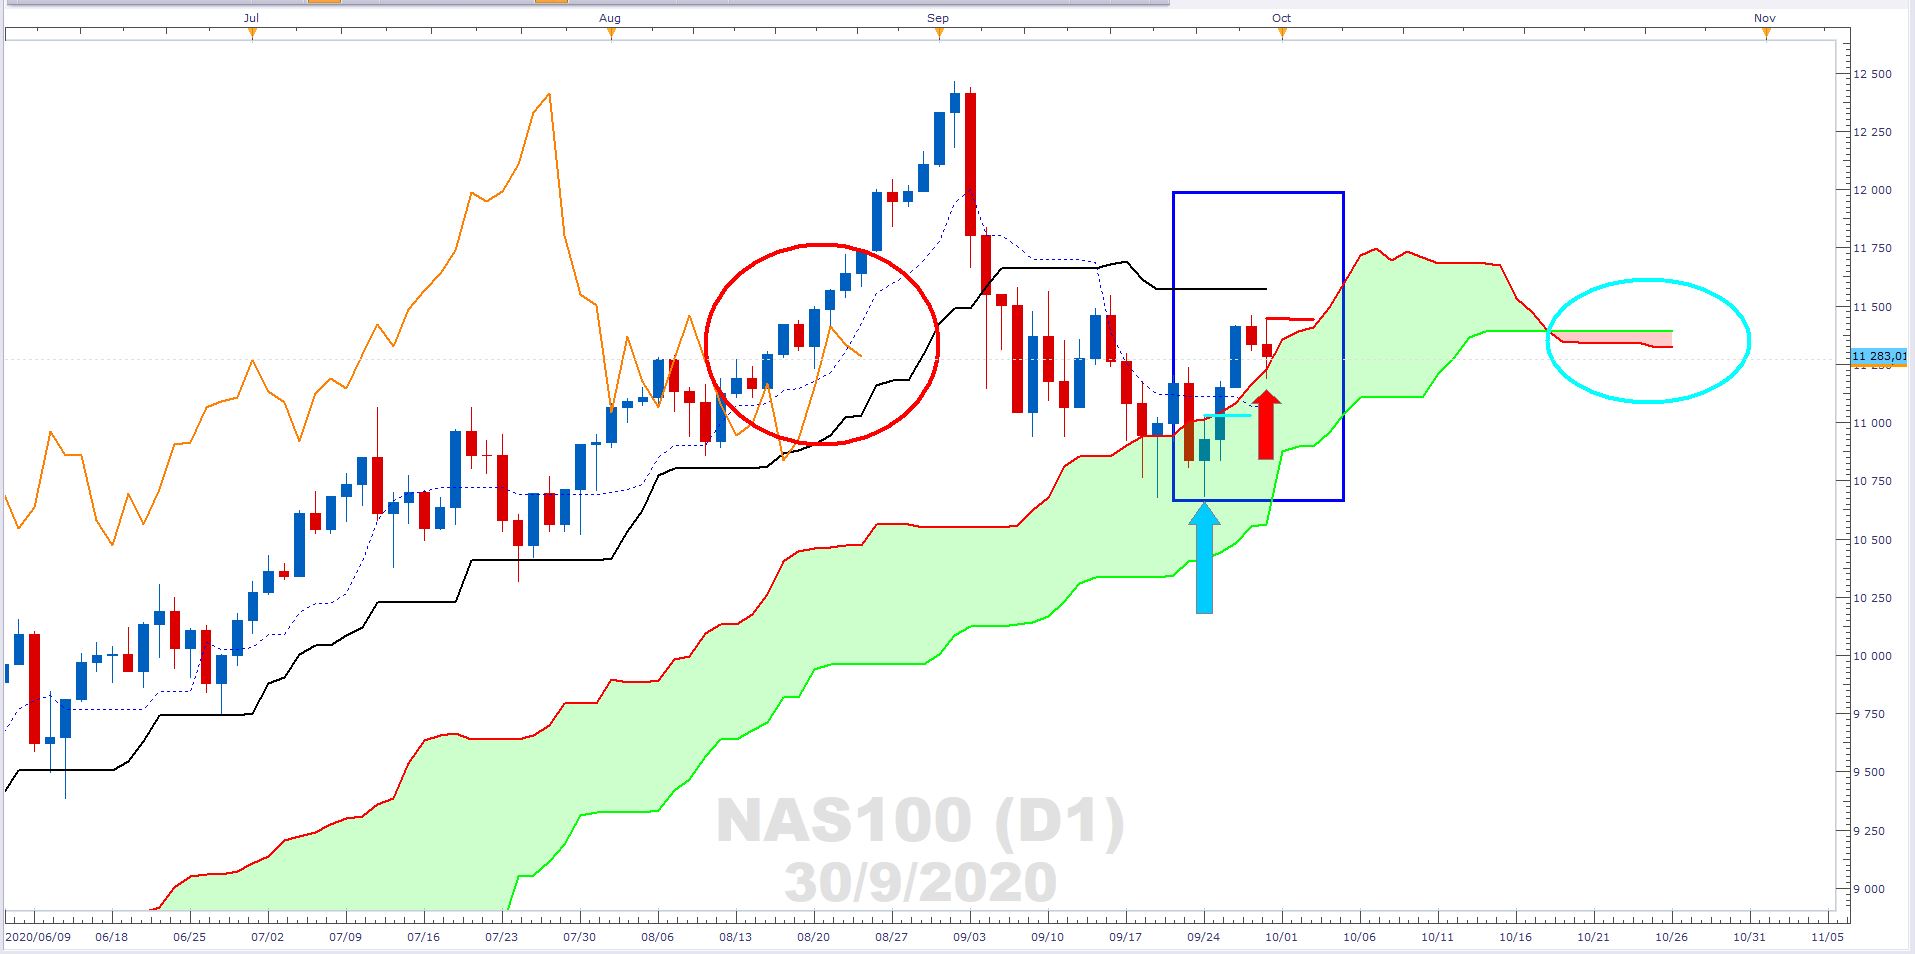
NAS100 supported by daily ichomoku cloud

The chart shows the daily Ichimoku chart, with the NAS100 holding at its cloud support.
-
The orange lagging line moving above price (red ellipse).
-
Price moving above the black base line and the base line starting to trend up (blue rectangle).
-
The forward cloud twisting and showing green.
Risk markets leading up to the November 3 elections are likely to show volatility. However, once this uncertainty settles, the liquidity injection by the Fed into the economy which continues to suppress yields at the lower-risk end of the spectrum is supportive. Moreover, the NAS100 showed the greatest relative strength of the indices after the markets bottomed in late March. As such, bullishness here is important for general risk buoyancy.
Past performance is not an indicator of future results.
CHART SOURCE: FXCM Marketscope 2.0
Author

Russell Shor (MSTA, CFTe, MFTA) has an Honours Degree in Economics from the University of South Africa and holds the coveted Certified Financial Technician and Master of Financial Technical Analysis qualifications from the Interna


