Mixed outlook forming as the Fed moves into its blackout period

Market Overview
Markets are increasingly sensitive to anything that could impact on the Federal Reserve’s thought process for the July FOMC meeting. In the last two sessions, there have been some dramatic swings in pricing for a 50 basis point rate cut. When centrist Williams suggested the Fed gets ahead of the curve, a massive shift was seen, with dollar selling and gold sharply higher. With the New York Fed subsequently dismissing Williams’s speech as academic (followed by a solid Michigan Sentiment reading on Friday), traders completely unwound their positioning. The spike to what was around 70% probability of 50bps cut on CME Group FedWatch is now back around 20% (where it was on Wednesday). EUR/USD and Gold saw similar moves higher with subsequent retracements. To sum up, traders are nervous about how to position themselves. The importance of this FOMC meeting at the end of the month is huge and with the Fed members now into their “blackout” period, markets will only have the economic data to go from. There is nothing of note today, so it could be a relatively quiet session. The oil price could be worth watching as traders react to the increasing geopolitical tensions in the Persian Gulf, initially higher today, but can the potential supply shock outweigh the impact of slowing demand growth.
Wall Street closed lower on Friday with the S&P 500 -0.6% at 2977, whilst there is a degree of support forming for US futures today which are +0.2%. Asian markets have been cautiously lower, with the Nikkei -0.2% and Shanghai Composite -1.1%. European markets are taking a mixed look to early moves, with FTSE futures +0.1% and DAX futures -0.1%. In forex, the recent swings on USD have left a mixed outlook early today, with the underperformance of JPY and CHF pointing to a mild improvement in risk appetite today. In commodities, we find some support forming for gold after the big retracement drop on Friday, whilst oil is over 1% higher.
It is a quiet start to the week on the economic calendar, with no major data due. However, it is certainly worth keeping an eye out for the Bank of Japan Governor Kuroda’s speech at 1600BST for any policy implications given the yen strength and trend of dovishness engulfing major central banks now.
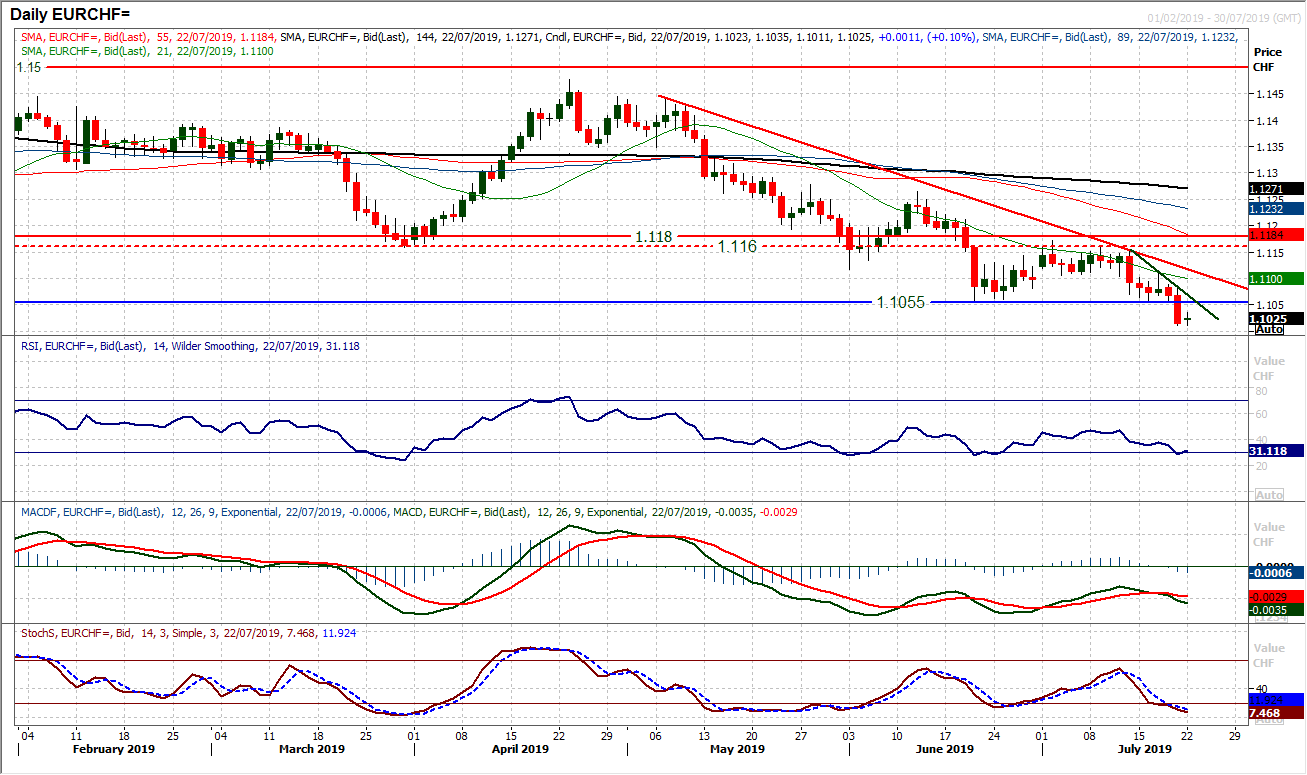
Chart of the Day – EUR/CHF
We have been calling for rallies to be used as a chance to sell ever since the key long term support band 1.1160/1.1180 was breached over a month ago. Old support becomes new resistance. The latest breakdown on Friday comes with the big bearish candle breakdown below 1.1055. Is this the time to sell? Although the MACD lines have only just bear crossed again, caution need to be taken. The big June breakdown, spent the next week or so unwinding back towards the resistance of the old support. Daily RSI is again below 30 but this limited the May and June downside. The hourly RSI is also overstretched and this all suggests there will be a better opportunity to sell on an technical unwind. Already we are seeing the market bouncing this morning, so timing it key here. There is a resistance band 1.1055/1.1110 whilst the resistance of a ten week downtrend falling at 1.1120 will also act as a gauge. There is initial support at 1.1010, with the latest breakdown having the pair trading at two year lows, with subsequent support at 1.0980 before 1.0830.
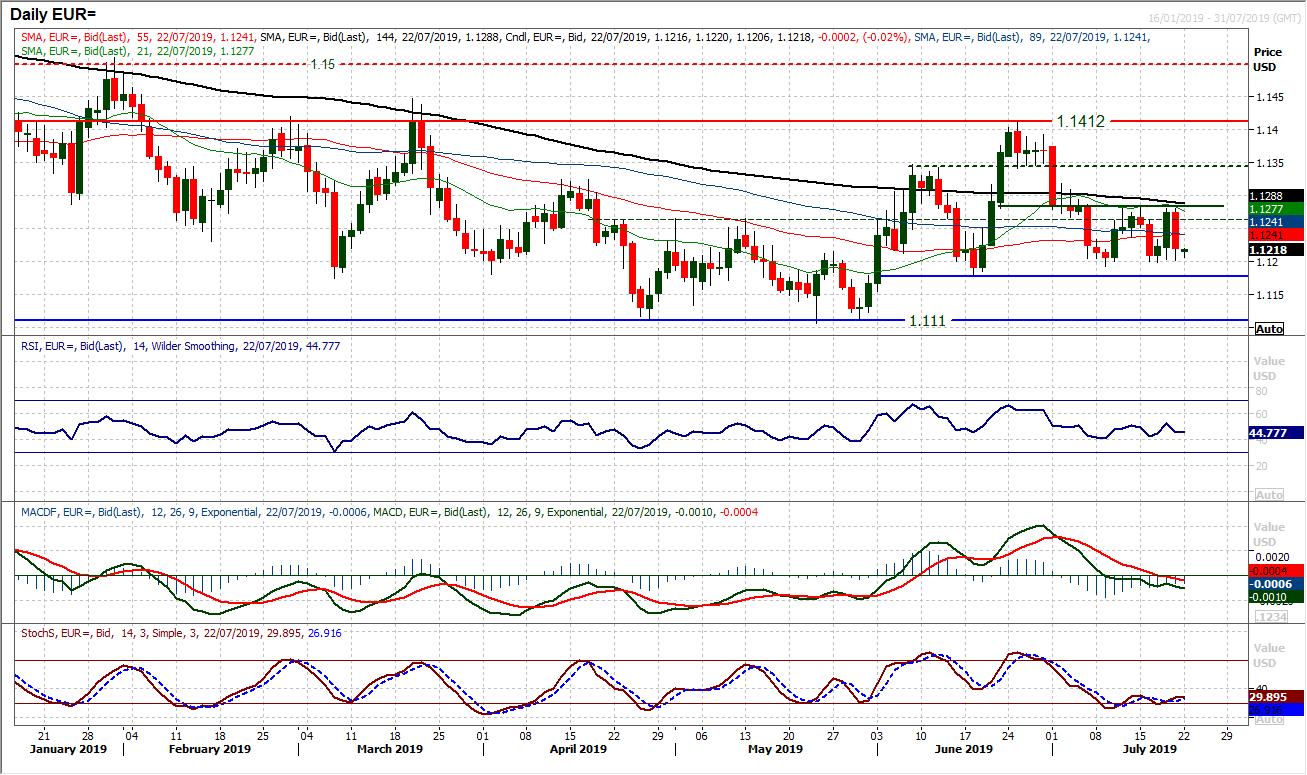
EUR/USD
The price action of the past couple of sessions just shows how uncertain the outlook is right now. A huge bull candle followed by an almost equal and entirely opposite bear candle. Back to where the pair was on Wednesday, fighting to hold on to the support from much of last week around $1.1200. There is little of any certainty right now, but the support band $1.1180/$1.1200 is holding. We are back in the mild negative bias again, trading slightly below a clutch of neutral moving averages, with momentum indicators shading slightly into correction territory. Until there is a closing breach of $1.1180 support or decisively above $1.1285 it is difficult to really take much out of EUR/USD. The hourly chart backs this too, but momentum is just swinging higher again this morning. Perhaps there is a mild gauge with a pivot band $1.1235/$1.1245, but this is certainly a chart lacking conviction right now.
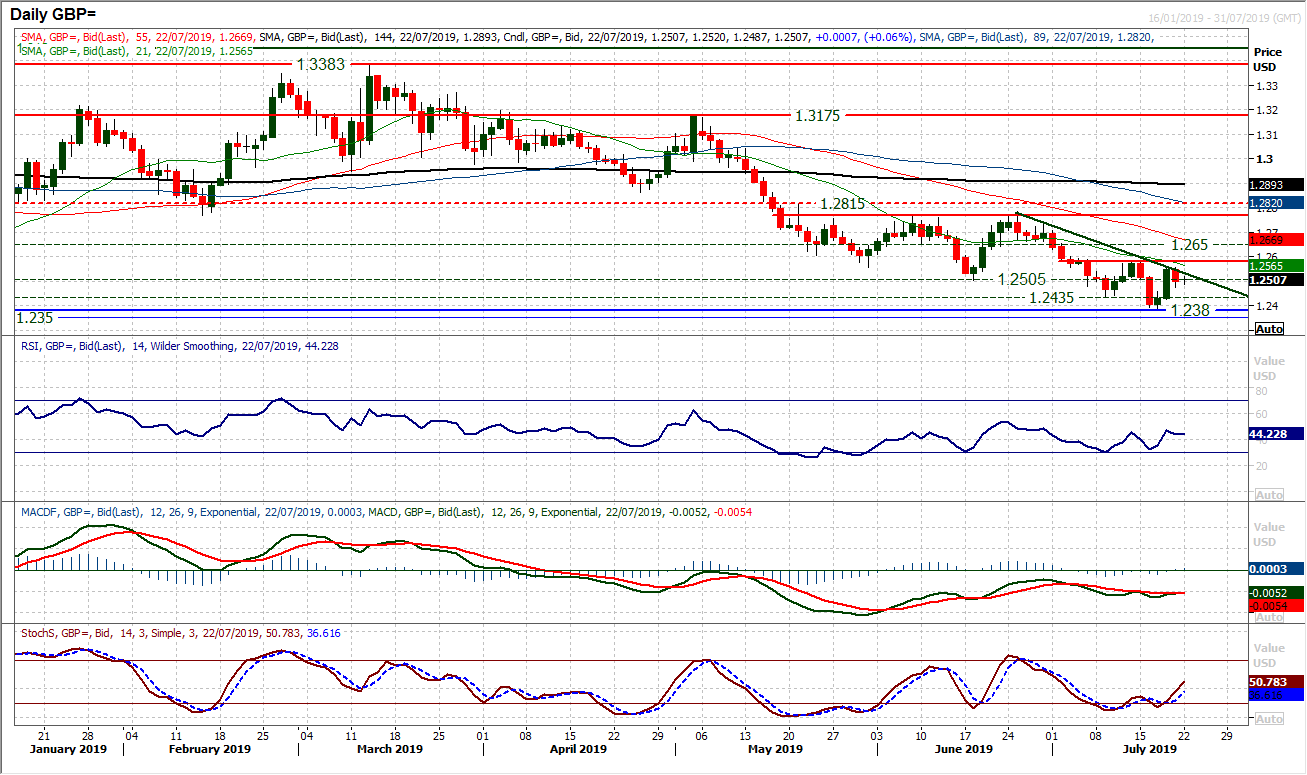
We continue to see Cable rallies as a chance to sell. A couple of positive sessions mid last week have dragged the market back into resistance area, where it fell over again on Friday. There is a downtrend that can be taken of the last few weeks, whilst momentum indicators are still correctively configured. There is still an outlook where near term bounces are seen as a selling opportunity. However, there is a caveat to all of this which will have the market nervous this week. The announcement of a new UK Prime Minister will have sterling traders on edge and increases the volatility in the market. Resistance at $1.2580 is a key lower high which is intact and is the first major support to watch and a breach would suggest a rebound was gathering momentum. The hourly chart shows initial support at $1.2450 above the $1.2380 key low.
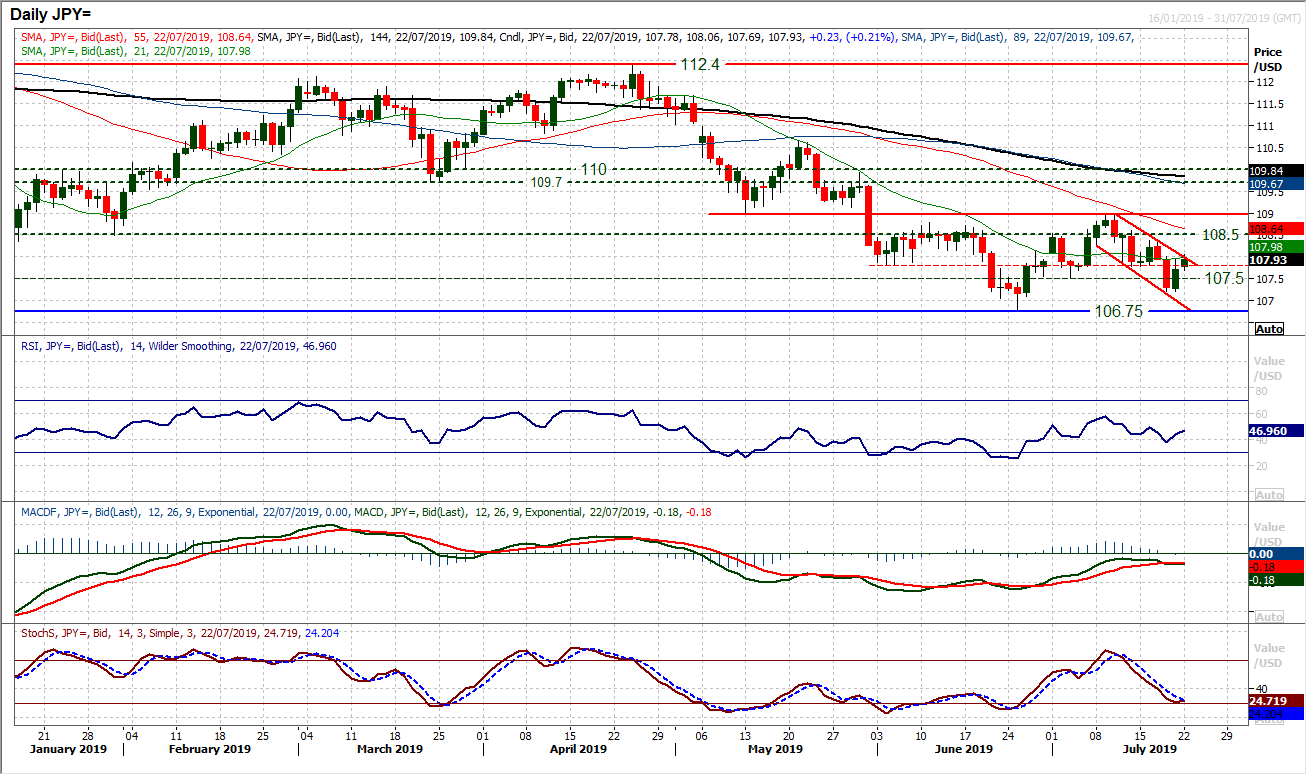
Having broken below 107.50 mid last week, the outlook turned increasingly negative within what has become a seven week range 106.75/109.00. Subsequently, despite the rebound on Friday, rallies should be seen as a chance to sell. There is a mini trend channel lower over the past couple of weeks which comes in at 108.00 today and this is the initial gauge. Previous support throughout July was based in the 107.50/107.80 range, so as an area of overhead supply, if the rebound can begin to build above this area, then the prospect of the bulls regaining some footing could take hold. However, until 108.35 is breached, there is little real technical improvement to be achieved. Momentum indicators are still medium term negatively configured, and suggest selling into strength is the dominant outlook. This despite a tick higher of the past couple of sessions.
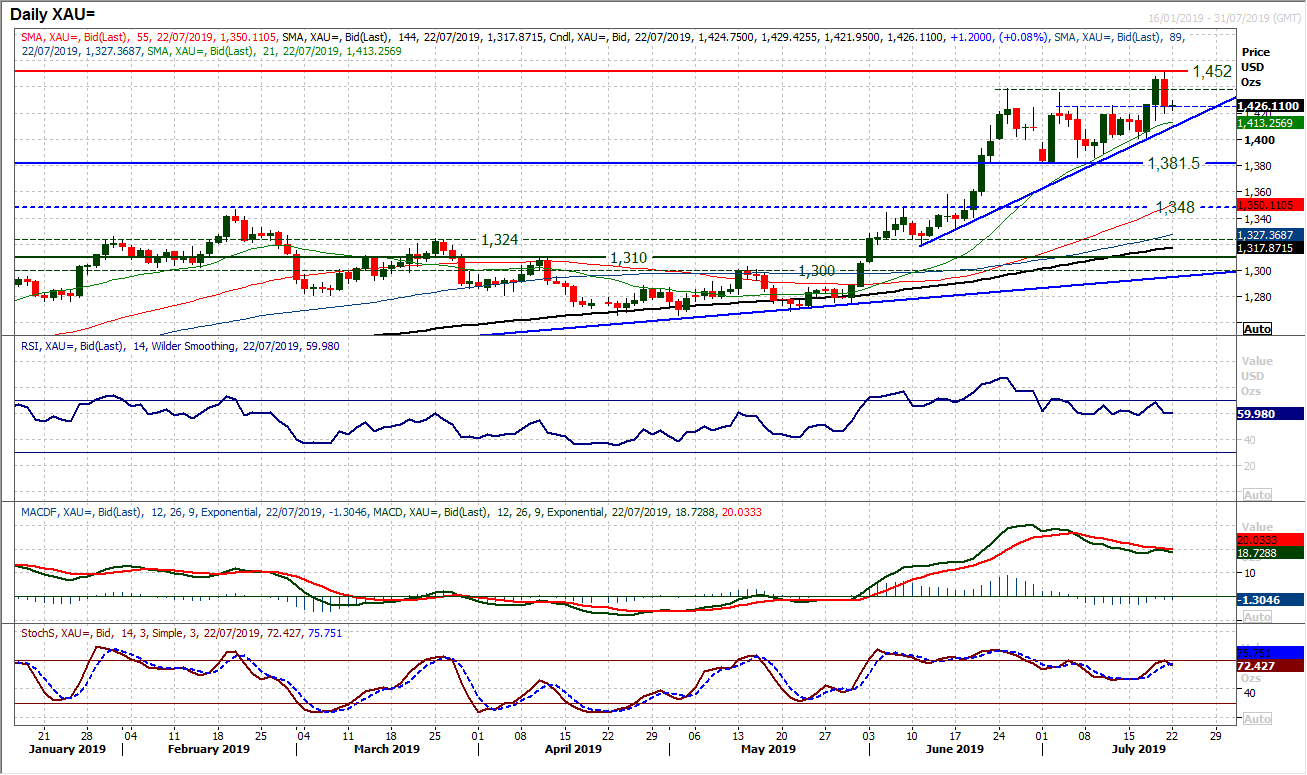
Gold
Once more, just when it looked as though the bulls had got away, the uncertainty in the market acted to drag the breakout back again. The unwinding move from Friday’s negative candle effectively neutralised Thursday’s breakout. However, this may have just been a false start. The bulls are looking to build on support again this morning. We talked on Friday about the breakout support band $1426/$1439. The bottom of this band may have been breached into the close on Friday but this was still the second highest close on gold for over six years. Momentum still points to a strong positioning, with the RSI around 60 and MACD lines poised. However, there needs to be a positive reaction in the coming days. There is an uptrend of the past six weeks which is supportive at $1410 but also watch the 21 day moving average underpinning the recent retreats, at $1413. The bulls will no doubt have been disappointed by Friday’s session, but it looks still to be an opportunity to buy. Resistance with the recent high at $1452 is key, with the hourly chart showing initial support at $1441.
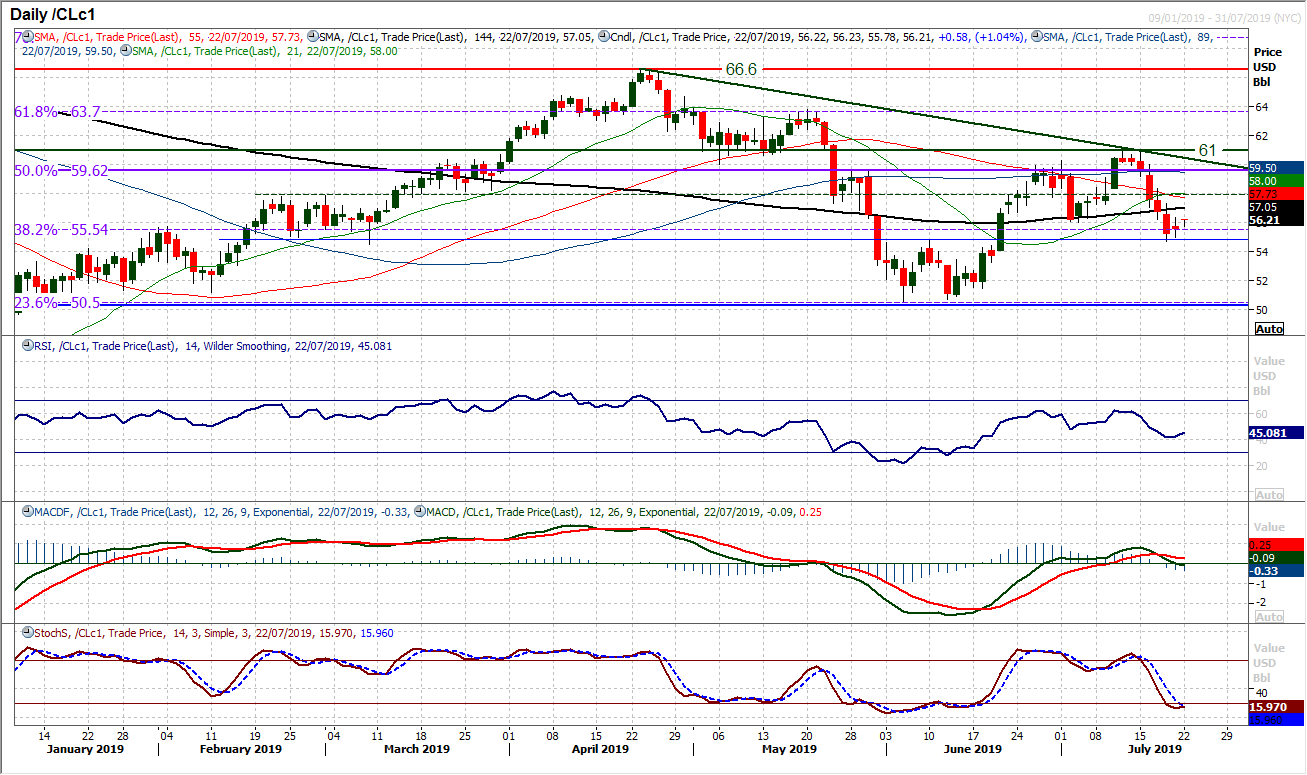
WTI Oil
The breakdown below $56.05 was a key move which has changed the near to medium term outlook. The market may have pulled marginally higher on Friday, but with the deterioration on momentum indicators, intraday rallies are struggling for traction. The MACD bear cross is the most worrying of the momentum signals now, being the first bear cross since the market sell off resumed back in April. Given the minor rebound of Friday, there is still a sense that a near term rally is an opportunity to sell. The hourly chart shows negative configuration still across momentum, with resistance at $57.30 as a lower high. The 38.2% Fibonacci retracement of $55.55 is still a consolidation point which if the bulls cannot get away in recovery will act as a drag. A move back below support at $54.70 would re-open the key lows of June at $50.60 which coincide with the 23.6% Fib level.
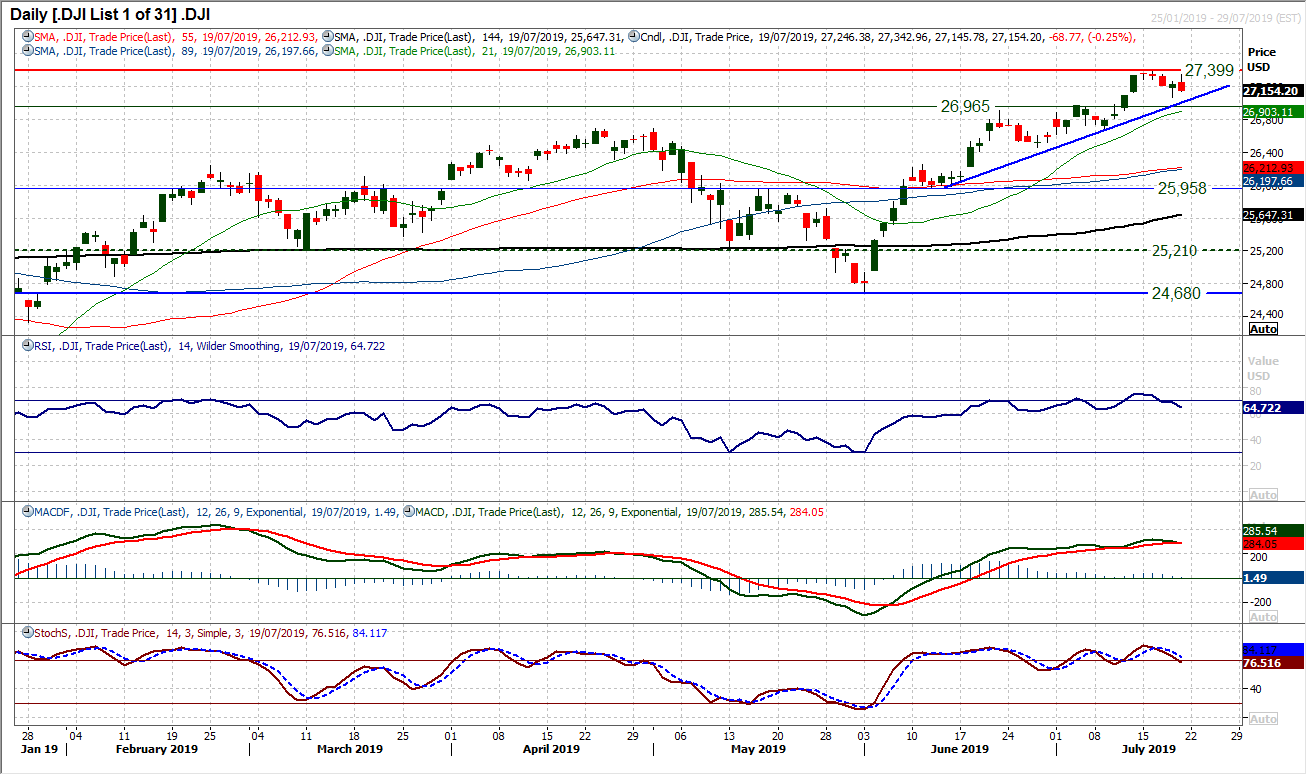
Dow Jones Industrial Average
It is turning into a rather uncertain period of trading for the Dow. An unwinding move early last week looked to have built renewed buying intent to eye the 27,399 all-time high again. However the bulls could not sustain the move and fell into the close on Friday. This has formed another negative candle that has turned up the negative pressure again. The support of a five week uptrend comes in at 27,045 today. This is another moment where the bulls need to step back in again. With the RSI again dropping into the mid to low-60s, MACD lines coming together and Stochastics falling away, momentum indicators are on the brink of a clutch of sell signals. A negative session today could tip them over the edge. Initial support is Thursday’s low at 27,069, whilst the breakout support at 26,965 is also important. These supports could come under test if momentum does post corrective signals. The key higher low at 26,666 is the first really important level though. Resistance under the all-time high is with 27,343.
Author

Richard Perry
Independent Analyst


