USD: Dec '24 is Down at 100.010.

Energies: Nov '24 Crude is Down at 67.70.

Financials: The Dec '24 30 Year T-Bond is Down 7 ticks and trading at 124.21.

Indices: The Dec '24 S&P 500 emini ES contract is 10 ticks Lower and trading at 5801.50.

Gold: The Dec'24 Gold contract is trading Down at 2659.90.

Initial conclusion

This is not a correlated market.  The USD is Down and Crude is Down which is not normal, and the 30 Year T-Bond is trading Lower.  The Financials should always correlate with the US dollar such that if the dollar is Higher, then the bonds should follow and vice-versa. The S&P is Lower and Crude is trading Lower which is not correlated. Gold is trading Lower which is not correlated with the US dollar trading Down.  I tend to believe that Gold has an inverse relationship with the US Dollar as when the US Dollar is down, Gold tends to rise in value and vice-versa. Think of it as a seesaw, when one is up the other should be down. I point this out to you to make you aware that when we don't have a correlated market, it means something is wrong. As traders you need to be aware of this and proceed with your eyes wide open. Asia traded Mixed with half the exchanges Higher and the other half Lower.  All of Europe is trading Lower. 

Possible challenges to traders

  • FOMC Member Bowman Speaks at 8:50 AM EST.  This is Major.

  • Chicago PMI is out at 9:45 AM EST.  This is Major.

  • Fed Chair Powell Speaks at 1:55 PM EST.  This is Major. 

Traders, please note that we've changed the Bond instrument from the 10 year (ZN) to the 2 year (ZT).  They work exactly the same.  

We've elected to switch gears a bit and show correlation between the 2-year Treasury notes (ZT) and the S&P futures contract.  The YM contract is the Dow Jones Industrial Average, and the purpose is to show reverse correlation between the two instruments.  Remember it's likened to a seesaw, when up goes up the other should go down and vice versa.

Last Friday the ZT migrated Higher at around 8:30 AM EST as the economic news was released and began its Upward climb.  Look at the charts below and you'll see a pattern for both assets. The Dow moved Lower at 8:30 AM and the ZT moved Higher at around the same time.  These charts represent the newest version of Bar Charts, and I've changed the timeframe to a 15-minute chart to display better.  This represented a Long opportunity on the 2-year note, as a trader you could have netted about 0 plus ticks per contract on this trade.   Each tick is worth $7.625.  Please note: the front month for ZT is Dec and the Dow is still Sept '24.  I've changed the format to filled Candlesticks (not hollow) such that it may be more apparent and visible.

Charts courtesy of Barcharts

Chart

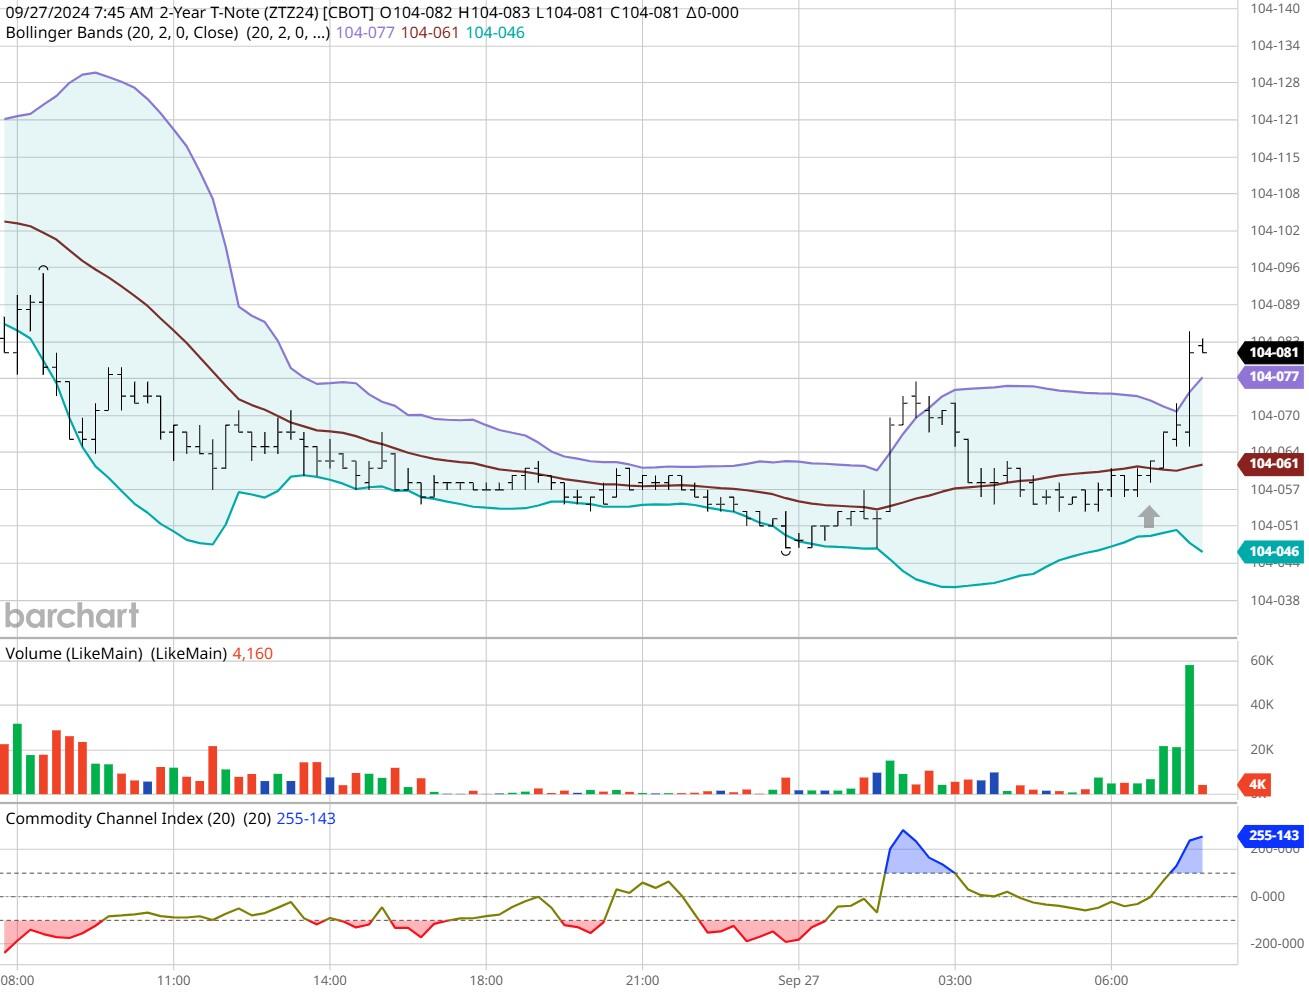
ZT -Dec 2024 - 09/27/24

Chart

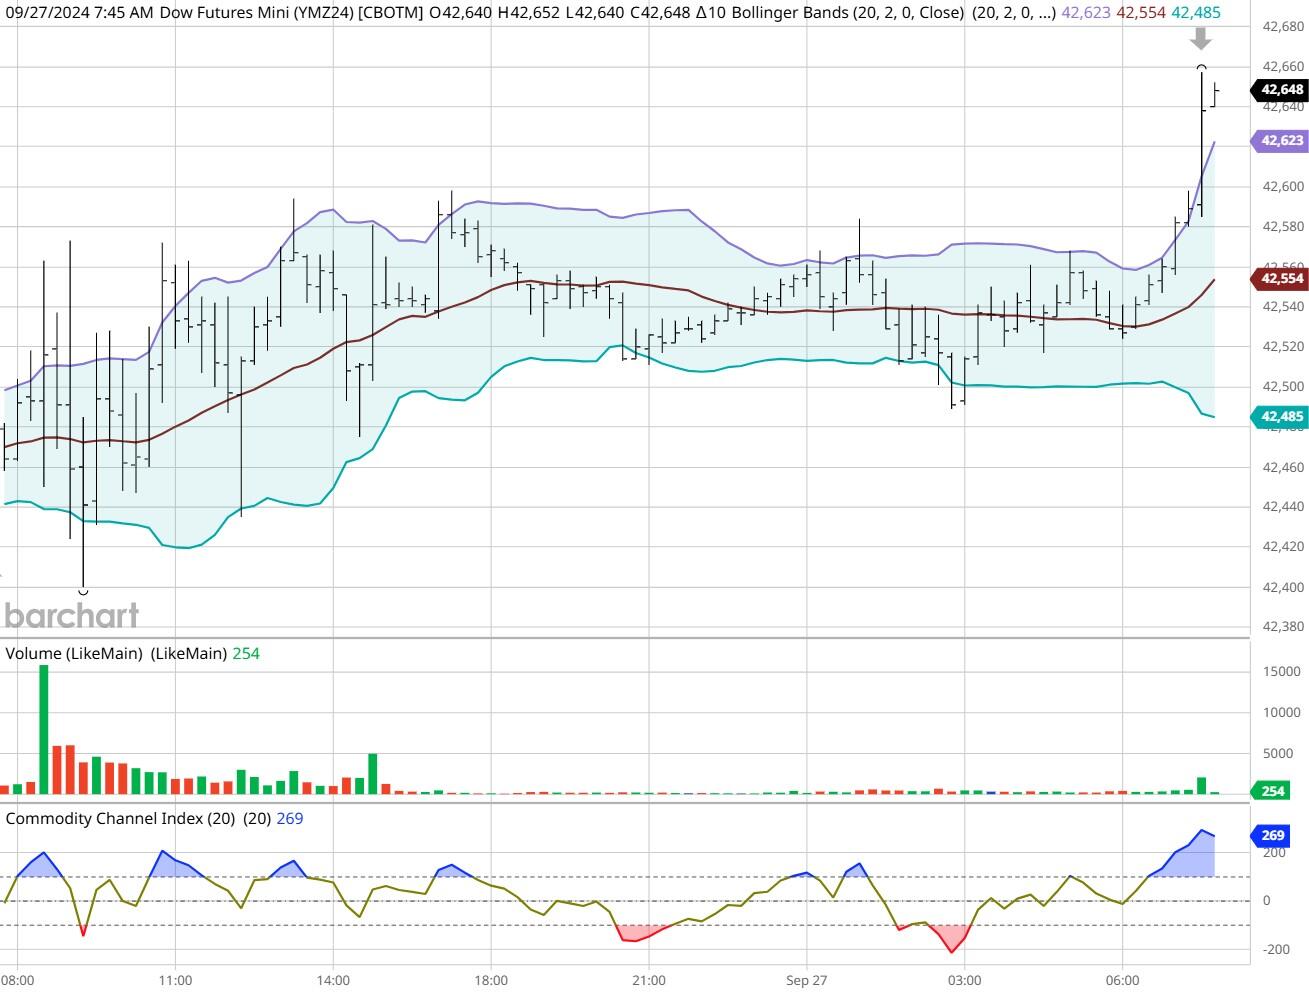
Dow - Dec 2024- 09/27/24

Bias

On Friday we gave the markets a Neutral or Mixed bias as we didn't see much evidence of Market Correlation Friday morning.  The markets however didn't disappoint as the Dow closed 138 points Higher but the S&P and Nasdaq both closed Lower.  All in all, a Neutral or Mixed day.  Today we aren't dealing with a correlated market and or bias will remain Neutral or Mixed.

Could this change? Of Course. Remember anything can happen in a volatile market. 

Commentary

On Friday we witnessed a near perfect example of market correlation in action.  The personal income and spending numbers were released at 8:30 am EST and both came in Lower which propelled the markets Lower, which in turn propelled the bonds and notes Higher.  Remember when one goes down the other rises.  Today we have Chicago PMI and Fed Chair Powell will speak this morning, both of which are major.

Trading performance displayed herein is hypothetical. The following Commodity Futures Trading Commission (CFTC) disclaimer should be noted.

Hypothetical performance results have many inherent limitations, some of which are described below. No representation is being made that any account will or is likely to achieve profits or losses similar to those shown.

In fact, there are frequently sharp differences between hypothetical performance results and the actual results subsequently achieved by any particular trading program. One of the limitations of hypothetical performance trading results is that they are generally prepared with the benefit of hindsight.

In addition, hypothetical trading does not involve financial risk, and no hypothetical trading record can completely account for the impact of financial risk in actual trading. For example, the ability to withstand losses or to adhere to a particular trading program in spite of trading losses are material points which can also adversely affect actual trading results.

There are numerous other factors related to the markets in general or to the implementation of any specific trading program which cannot be fully accounted for in the preparation of hypothetical performance results and all of which can adversely affect actual trading results.

Trading in the commodities markets involves substantial risk and YOU CAN LOSE A LOT OF MONEY, and thus is not appropriate for everyone. You should carefully consider your financial condition before trading in these markets, and only risk capital should be used.

In addition, these markets are often liquid, making it difficult to execute orders at desired prices. Also, during periods of extreme volatility, trading in these markets may be halted due to so-called “circuit breakers” put in place by the CME to alleviate such volatility. In the event of a trading halt, it may be difficult or impossible to exit a losing position.

Recommended Content


Recommended Content

Editors’ Picks

EUR/USD bulls maintain the pressure ahead of critical US employment data

EUR/USD bulls maintain the pressure ahead of critical US employment data

EUR/USD clings to small daily gains slightly below 1.1200 on Monday. ECB President Lagarde told the European Parliament that their confidence on inflation returning to target has strengthened after the latest developments. Markets await Fed Chairman Powell's speech.

EUR/USD News
GBP/USD fluctuates at around 1.3400 ahead of Powell

GBP/USD fluctuates at around 1.3400 ahead of Powell

GBP/USD trades in a narrow channel at around 1.3400 in the second half of the day on Monday. The US Dollar benefits from the cautious market mood and holds its ground as investors' focus shifts to Fed Chairman Powell's speech.

GBP/USD News
Gold extends slide and pierces $2,630

Gold extends slide and pierces $2,630

Gold extends its downward correction to start the week and trades deep in negative territory near $2,630. Profit-taking ahead of the long Chinese holiday and the cautious market mood seems to be weighing on XAU/USD as markets await Fed Chairman Powell's speech.

Gold News
Johann Kerbrat, Robinhood Crypto GM: “US regulation to be late compared to EU and Asia”

Johann Kerbrat, Robinhood Crypto GM: “US regulation to be late compared to EU and Asia”

Johann Kerbrat is the Crypto General Manager at Robinhood, the trading app used by many US retail investors during the 2020 meme stock mania.

Read more
RBA widely expected to keep key interest rate unchanged amid persisting price pressures

RBA widely expected to keep key interest rate unchanged amid persisting price pressures

The Reserve Bank of Australia is likely to continue bucking the trend adopted by major central banks of the dovish policy pivot, opting to maintain the policy for the seventh consecutive meeting on Tuesday.

Read more
Five best Forex brokers in 2024

Five best Forex brokers in 2024

VERIFIED Choosing the best Forex broker in 2024 requires careful consideration of certain essential factors. With the wide array of options available, it is crucial to find a broker that aligns with your trading style, experience level, and financial goals. 

Read More

Majors

Cryptocurrencies

Signatures