USD: Mar '24 is Down at 102.925.

Energies: Mar '24 Crude is Down at 74.19.

Financials: The Mar '24 30 Year T-Bond is Up 19 ticks and trading at 120.13.

Indices: The Dec '23 S&P 500 emini ES contract is 46 ticks Higher and trading at 4915.00.

Gold: The Feb'24 Gold contract is trading Up at 2034.00.  

Initial conclusion

This is not a correlated market.  The USD is Down and Crude is Down which is not normal, but the 30 Year T-Bond is trading Higher. The Financials should always correlate with the US dollar such that if the dollar is Higher, then the bonds should follow and vice-versa. The S&P is Higher and Crude is trading Lower which is correlated. Gold is trading Higher which is correlated with the US dollar trading Down. I tend to believe that Gold has an inverse relationship with the US Dollar as when the US Dollar is down, Gold tends to rise in value and vice-versa. Think of it as a seesaw, when one is up the other should be down. I point this out to you to make you aware that when we don't have a correlated market, it means something is wrong. As traders you need to be aware of this and proceed with your eyes wide open.  Asia is trading mainly Higher with the exception of the Japanese Nikkei which is Down.  Currently all of Europe is trading Higher.

Possible challenges to traders

  • Flash Manufacturing PMI is out at 9:45 AM EST. This is Major.

  • Flash Services PMI is out at 9:45 AM EST. This is Major.

  • Crude Oil Inventories is out at 10:30 AM EST. This is Major.

Treasuries

Traders, please note that we've changed the Bond instrument from the 30 year (ZB) to the 10 year (ZN). They work exactly the same.  

We've elected to switch gears a bit and show correlation between the 10-year bond (ZN) and the S&P futures contract. The S&P contract is the Standard and Poor's, and the purpose is to show reverse correlation between the two instruments. Remember it's likened to a seesaw, when up goes up the other should go down and vice versa.  

Yesterday the ZN migrated Lower at around 9:30 AM EST as the S&P hit a Low at around the same time. If you look at the charts below the S&P gave a signal at around 9:30 AM and the ZN started its Downward trend.  Look at the charts below and you'll see a pattern for both assets. S&P hit a Low at around 9:30 AM and migrated Lower.  These charts represent the newest version of MultiCharts and I've changed the timeframe to a 15-minute chart to display better. This represented a Short opportunity on the 10-year note, as a trader you could have netted about 12 ticks per contract on this trade. Each tick is worth $15.625.  Please note: the front month for the ZN is now Mar '24. The S&P contract is now Mar' 24. I've changed the format to filled Candlesticks (not hollow) such that it may be more apparent and visible.  

Charts courtesy of MultiCharts built on an AMP platform

Chart

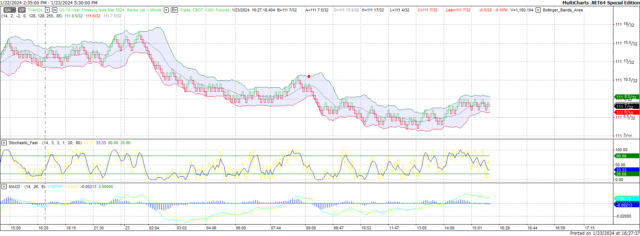
ZN - Mar 2024 - 01/23/24

Chart

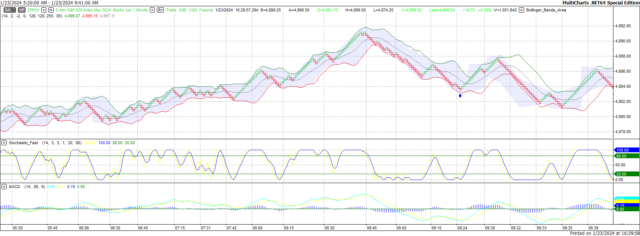
S&P - Mar 2024 - 01/23/24

Bias

Yesterday we gave the markets a Neutral or Mixed bias as we didn't much in the way of correlation Tuesday morning. The markets however didn't disappoint as the Dow closed Lower by 96 points and the other indices closed Lower. All in all, a Neutral or Mixed day. Today we aren't dealing with a correlated market and our bias is to the Upside.

Could this change? Of Course. Remember anything can happen in a volatile market. 

Commentary

Yesterday we predicted a Neutral or Mixed day due to the New Hampshire primary. Today we have the PMI numbers and crude oil inventories.  Will this provide a trend for the markets today?  Only time will tell...

Trading performance displayed herein is hypothetical. The following Commodity Futures Trading Commission (CFTC) disclaimer should be noted.

Hypothetical performance results have many inherent limitations, some of which are described below. No representation is being made that any account will or is likely to achieve profits or losses similar to those shown.

In fact, there are frequently sharp differences between hypothetical performance results and the actual results subsequently achieved by any particular trading program. One of the limitations of hypothetical performance trading results is that they are generally prepared with the benefit of hindsight.

In addition, hypothetical trading does not involve financial risk, and no hypothetical trading record can completely account for the impact of financial risk in actual trading. For example, the ability to withstand losses or to adhere to a particular trading program in spite of trading losses are material points which can also adversely affect actual trading results.

There are numerous other factors related to the markets in general or to the implementation of any specific trading program which cannot be fully accounted for in the preparation of hypothetical performance results and all of which can adversely affect actual trading results.

Trading in the commodities markets involves substantial risk and YOU CAN LOSE A LOT OF MONEY, and thus is not appropriate for everyone. You should carefully consider your financial condition before trading in these markets, and only risk capital should be used.

In addition, these markets are often liquid, making it difficult to execute orders at desired prices. Also, during periods of extreme volatility, trading in these markets may be halted due to so-called “circuit breakers” put in place by the CME to alleviate such volatility. In the event of a trading halt, it may be difficult or impossible to exit a losing position.

Recommended Content


Recommended Content

Editors’ Picks

EUR/USD clings to strong daily gains above 1.0900

EUR/USD clings to strong daily gains above 1.0900

EUR/USD trades at fresh multi-month highs above 1.0900 in the American session on Tuesday. The Euro benefits from news that Germany's Greens are predicting a spending deal this week. Meanwhile, the US Dollar stays under pressure amid growing recession fears.

EUR/USD News
GBP/USD stabilizes above 1.2900 on renewed USD weakness

GBP/USD stabilizes above 1.2900 on renewed USD weakness

GBP/USD trades in positive territory above 1.2900 on Tuesday. The pair advances as the US Dollar struggles to recover on growing concerns over the Trump administration's trade policy causing the US economy to tilt into recession.

GBP/USD News
Gold rises above $2,910; erases Monday's fall to one-week low

Gold rises above $2,910; erases Monday's fall to one-week low

Gold reverses its direction following Monday's decline and trades above $2,910 on Tuesday. Investors remain worried about the potential economic fallout from US President Trump's tariffs, causing the USD to stay under pressure and supporting XAU/USD.

Gold News
The crypto market cap dips to $2.44 trillion while Mt. Gox moves 11,833 BTC worth $932 million

The crypto market cap dips to $2.44 trillion while Mt. Gox moves 11,833 BTC worth $932 million

The crypto market continued its ongoing downleg as the week started, as its market cap capitalization reached a low of $2.44 trillion on Tuesday, levels not seen since early November.

Read more
Gold rises above $2,910; erases Monday's fall to one-week low

Gold rises above $2,910; erases Monday's fall to one-week low

Gold reverses its direction following Monday's decline and trades above $2,910 on Tuesday. Investors remain worried about the potential economic fallout from US President Trump's tariffs, causing the USD to stay under pressure and supporting XAU/USD.

Gold News
The Best brokers to trade EUR/USD

The Best brokers to trade EUR/USD

SPONSORED Discover the top brokers for trading EUR/USD in 2025. Our list features brokers with competitive spreads, fast execution, and powerful platforms. Whether you're a beginner or an expert, find the right partner to navigate the dynamic Forex market.

Read More

Majors

Cryptocurrencies

Signatures

Best Brokers of 2025