For months the Fed has been complaining of an overheated market

USD: Dec '23 is Down at 101.200.
Energies: Jan '24 Crude is Up at 74.69.
Financials: The Mar '24 30 Year T-Bond is Up 14 ticks and trading at 124.13.
Indices: The Dec '23 S&P 500 emini ES contract is 14 ticks Lower and trading at 4793.25.
Gold: The Feb'24 Gold contract is trading Up at 2073.20
Initial conclusion
This is not a correlated market. The USD is Down and Crude is Up which is normal, but the 30-year T-Bond is trading Higher. The Financials should always correlate with the US dollar such that if the dollar is Higher, then the bonds should follow and vice-versa. The S&P is Lower and Crude is trading Higher which is correlated. Gold is trading Higher which is correlated with the US dollar trading Down. I tend to believe that Gold has an inverse relationship with the US Dollar as when the US Dollar is down, Gold tends to rise in value and vice-versa. Think of it as a seesaw, when one is up the other should be down. I point this out to you to make you aware that when we don't have a correlated market, it means something is wrong. As traders, you need to be aware of this and proceed with your eyes wide open. Asia is trading Mixed. Currently Europe is trading Higher with the exception of the German Dax which is Lower.
Possible challenges to traders
-
Core PCE Price Index m/m is out at 8:30 AM EST. This is Major.
-
Core Durable Goods Orders m/m are out at 8:30 AM EST. This is Major.
-
Durable Goods is out at 8:30 AM EST. This is Major.
-
Personal Income m/m is out at 8:30 AM EST. This is Major.
-
Personal Spending m/m is out at 10 AM EST. This is Major.
-
New Home Sales is out at 10 AM EST. This is Major.
-
Revised UoM Consumer Sentiment is out at 10 AM EST. This is Not Major.
-
Revised UoM Inflation Expectations is out at 10 AM EST. This is Not Major.
Treasuries
Traders, please note that we've changed the Bond instrument from the 30 year (ZB) to the 10 year (ZN). They work exactly the same.
We've elected to switch gears a bit and show correlation between the 10-year bond (ZN) and the S&P futures contract. The S&P contract is the Standard and Poor's, and the purpose is to show reverse correlation between the two instruments. Remember it's likened to a seesaw, when up goes up the other should go down and vice versa.
Yesterday the ZN migrated Lower at around 9:35 AM EST as the S&P hit a Low at around the same time. If you look at the charts below the S&P gave a signal at around 9:35 AM and the ZN started its Downward trend. Look at the charts below and you'll see a pattern for both assets. S&P hit a Low at around 9:35 AM and migrated Higher. These charts represent the newest version of MultiCharts and I've changed the timeframe to a 15-minute chart to display better. This represented a Short opportunity on the 10-year note, as a trader you could have netted about 20 plus ticks per contract on this trade. Each tick is worth $15.625. Please note: the front month for the ZN is now Mar '24. The S&P contract is now Mar' 24. I've changed the format to filled Candlesticks (not hollow) such that it may be more apparent and visible.
Charts courtesy of MultiCharts built on an AMP platform
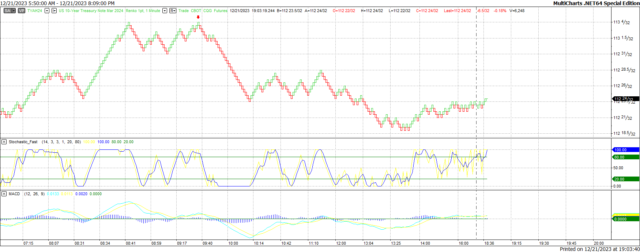
ZN - Mar 2024 - 12/21/23
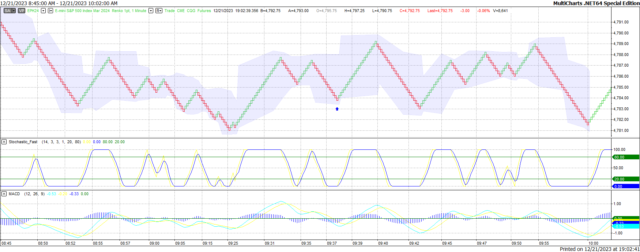
S&P - Mar 2024 - 12/21/23
Bias
Yesterday we suggested an Upside bias as the USD and Bonds were both trading Lower and that usually reflects an Upside Day. The markets didn't disappoint as the Dow gained 322 points and the other indices traded Higher as well. Today we aren't dealing with a correlated market and our bias is to the Downside.
Could this change? Of Course. Remember anything can happen in a volatile market.
Commentary
Yesterday the economic news reported wasn't exactly stellar. The GDP number reported was a dip from previous releases, yet the markets closed Higher. You might be asking "well how could that be? How can the markets go Higher when the reported number dropped?" For months the Federal Reserve has been complaining of an overheated market and has been seeking ways to cool it down. They didn't have to figure on anything as the American consumer has done that for them. Now that we have a cooled GDP, there is a strong likelihood that the Fed will reduce rates, which is what everyone wants. Today is the last trading day before a major holiday in the United States. We have about 8 economic reports, but I suspect that traders will be heading for the exit doors early. This being said we will be back on Tuesday; December 26th as Monday is Christmas Day. We wish you and yours a very safe and Happy Holiday!!!! Enjoy all!!!!
Author

Nick Mastrandrea
Market Tea Leaves


