Markets wrap up 2024 with a downside bias

Good Morning Traders,
As of this writing 6:40 AM EST, here's what we see:
USD: Mar '25 is Down at 107.790.
Energies: Feb '25 Crude is Up at 71.49.
Financials: The Mar '25 30 Year T-Bond is Up 14 ticks and trading at 114.17.
Indices: The Mar '25 S&P 500 emini ES contract is 70 ticks Higher and trading at 5976.25.
Gold: The Feb'25 Gold contract is trading Up at 2622.50.
Initial Conclusion
This is not a correlated market. The USD is Down and Crude is Up which is normal, but the 30 Year T-Bond is trading Higher. The Financials should always correlate with the US dollar such that if the dollar is Higher, then the bonds should follow and vice-versa. The S&P is Higher and Crude is trading Higher which is not correlated. Gold is trading Higher which is correlated with the US dollar trading Down. I tend to believe that Gold has an inverse relationship with the US Dollar as when the US Dollar is down, Gold tends to rise in value and vice-versa. Think of it as a seesaw, when one is up the other should be down. I point this out to you to make you aware that when we don't have a correlated market, it means something is wrong. As traders you need to be aware of this and proceed with your eyes wide open. Asia traded mainly Lower with the exception of the Hang Seng exchange. Europe is trading Higher with the exception of the German Dax exchange.
Possible Challenges to Traders
S&P/CS Composite-20 HPI y/y is out at 9 AM EST. This is Major.
HPI m/m is out at 9 AM EST. This is Major.
Traders, please note that we've changed the Bond instrument from the 10 year (ZN) to the 2 year (ZT). They work exactly the same.
We've elected to switch gears a bit and show correlation between the 2-year Treasury notes (ZT) and the S&P futures contract. The YM contract is the Dow Jones Industrial Average, and the purpose is to show reverse correlation between the two instruments. Remember it's likened to a seesaw, when up goes up the other should go down and vice versa.
Yesterday the ZT migrated Lower at around 9:20 AM EST with no news in sight. The Dow climbed Higher at the same time. Look at the charts below and you'll see a pattern for both assets. The Dow moved Higher at 9:20 AM EST and the ZT moved Lower at around the same time. These charts represent the newest version of Bar Charts, and I've changed the timeframe to a 15-minute chart to display better. This represented a Short opportunity on the 2-year note, as a trader you could have netted about 10 plus ticks per contract on this trade. Each tick is worth $7.625. Please note: the front month for ZT is now Mar '25 and the Dow is now Mar '25. I've changed the format to filled Candlesticks (not hollow) such that it may be more apparent and visible.
Charts Courtesy of BarCharts Click on an image to enlarge
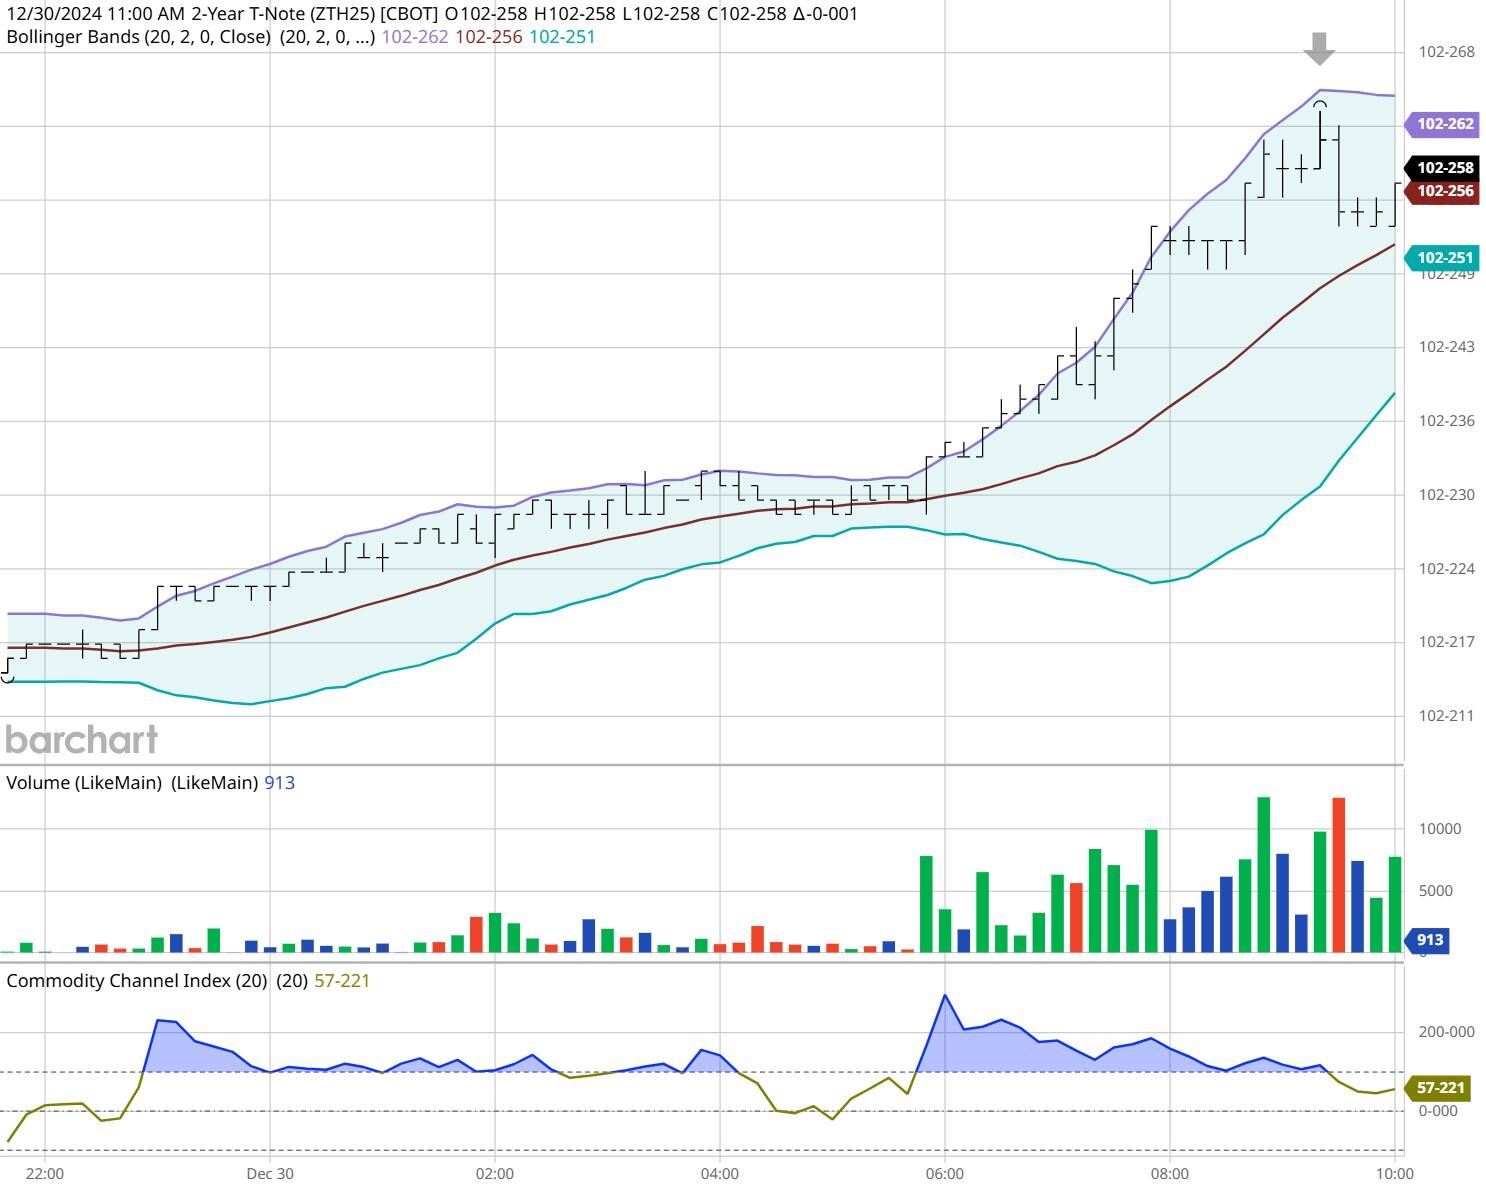
ZT -Mar 2025 - 12/30/24
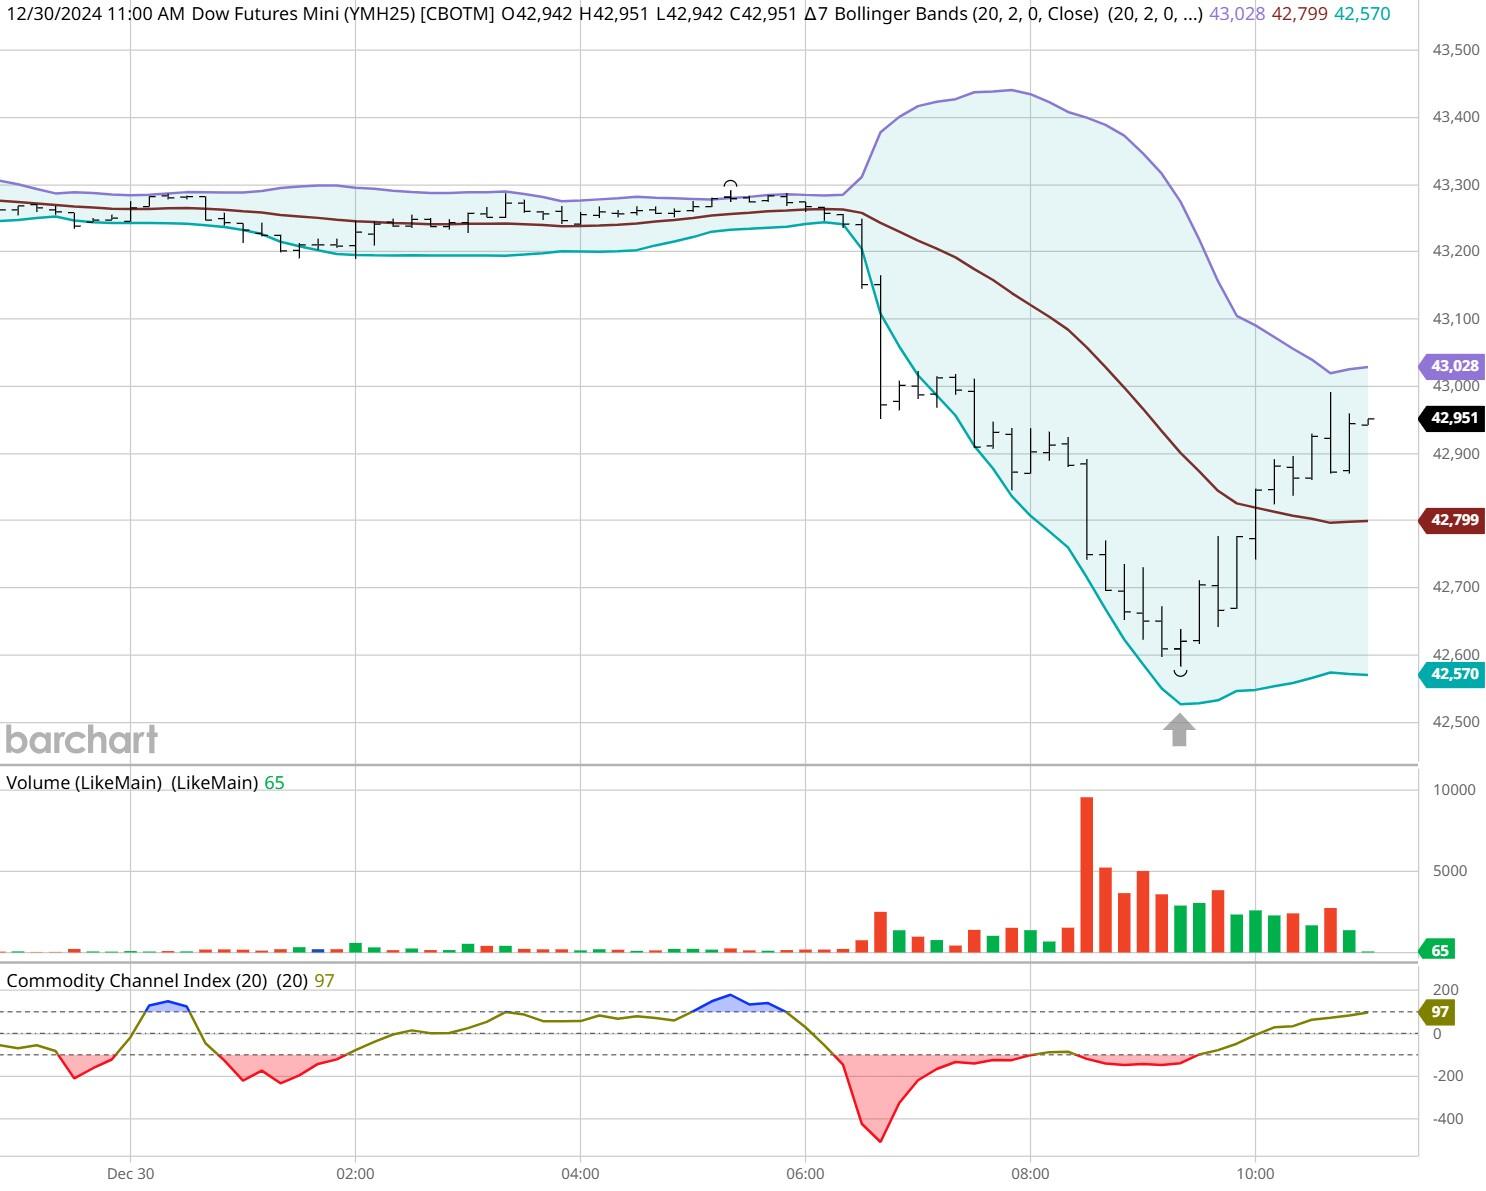
Dow - Mar 2025- 12/30/24
Bias
Yesterday we gave the markets a Downside bias and the markets didn't disappoint. The Dow closed Lower by 418 points, and the other indices closed Lower as well. Today we aren't dealing with a correlated market, and our bias is Neutral or Mixed.
Could this change? Of Course. Remember anything can happen in a volatile market.
Commentary
Yesterday we suggested a Down Day and the markets didn't disappoint. We saw no evidence of Upward movement yesterday hence the Downside bias. Today is an abbreviated day with the New Year holiday; the bond market will close at 2 PM EST but the stock market itself will close at normal time. Personally, I think traders will be heading for the exit doors early as if someone didn't reach their earning goal by today, one more day won't make a difference. Personally, I wish you all a very Happy New Year and trust that we will have continued success in 2025. We will be back on Thursday, January 2nd
Just so you understand, Market Correlation is Market Direction. It attempts to determine the market direction for that day, and it does so by using a unique set of tools.
As readers are probably aware I don't trade equities. While we're on this discussion, let's define what is meant by a good earnings report. A company must exceed their prior quarter's earnings per share and must provide excellent forward guidance. Any falloff between earning per share or forward guidance will not bode well for the company's shares. This is one of the reasons I don't trade equities but prefer futures. There are no earnings reports with futures, and we don't have to be concerned about lawsuits, scandals, malfeasance, etc. Anytime the market isn't correlated it's giving you a clue that something isn't right, and you should proceed with caution. Today our bias is Neutral or Mixed. Could this change? Of course. In a volatile market anything can happen. We'll have to monitor and see.
As I write this the crude markets are Higher, and the S&P is Higher. This is not normal. Crude and the markets are now reverse correlated such that when the markets are rising, crude drops and vice-versa. Yesterday Feb crude dropped to a low of $ 69.44 a barrel. Will it remain below $100 a barrel? Only time will tell. Crude still hasn't returned to a sense of normalcy therefore we can't quote support and resistance numbers. Remember that crude is the only commodity that is reflected immediately at the gas pump. Please note that the front month for crude is now Feb '25.
If trading crude today, consider doing so after 10 AM when the markets give us better direction.
Crude Oil Is Trading Higher
Crude oil is trading Higher, and the S&P is Higher. This is not normal. Crude typically makes 3 major moves (long or short) during the course of any trading day: around 9 AM EST, 11 AM EST and 2 PM EST when the crude market closes. If crude makes major moves around those time frames, then this would suggest normal trending, if not it would suggest that something is not quite right. As always watch and monitor your order flow as anything can happen in this market. This is why monitoring order flow in today's market is crucial. We as traders are faced with numerous challenges that we didn't have a few short years ago. High Frequency Trading is one of them. I'm not an advocate of scalping however in a market as volatile as this scalping is an alternative to trend trading. Remember that without knowledge of order flow we as traders are risking our hard-earned capital and the Smart Money will have no issue taking it from us. Regardless of whatever platform you use for trading purposes you need to make sure it's monitoring order flow. To fully capitalize on this newsletter, it is important that the reader understand how the various markets correlate. More on this in subsequent editions.
Author

Nick Mastrandrea
Market Tea Leaves


