USD: Dec '23 is Down at 104.750.

Energies: Dec '23 Crude is Up at 81.86.

Financials: The Dec '23 30 Year T-Bond is Down 13 ticks and trading at 113.08.

Indices: The Dec '23 S&P 500 emini ES contract is 32 ticks Higher and trading at 4384.00. 

Gold: The Dec'23 Gold contract is trading Down at 1993.50.  

Initial conclusion

This is not a correlated market.  The USD is Down and Crude is Up which is normal, and the 30 Year T-Bond is trading Lower.  The Financials should always correlate with the US dollar such that if the dollar is Higher, then the bonds should follow and vice-versa. The S&P is Higher, and Crude is trading Higher which is not correlated. Gold is trading Lower which is not correlated with the US dollar trading Down.  I tend to believe that Gold has an inverse relationship with the US Dollar as when the US Dollar is down, Gold tends to rise in value and vice-versa. Think of it as a seesaw, when one is up the other should be down. I point this out to you to make you aware that when we don't have a correlated market, it means something is wrong. As traders you need to be aware of this and proceed with your eyes wide open.  All of Asia is trading Higher. Europe is trading mainly Lower with the exception of the Milan exchange which is Lower at this time.

Possible challenges to traders

  • FOMC Member Cook Speaks at 11 AM EST. This is Major.

  • Loan Officer Survey - tentative.  This is Major.

Treasuries

Traders, please note that we've changed the Bond instrument from the 30 year (ZB) to the 10 year (ZN). They work exactly the same.  

We've elected to switch gears a bit and show correlation between the 10-year bond (ZN) and the S&P futures contract.  The S&P contract is the Standard and Poor's, and the purpose is to show reverse correlation between the two instruments.  Remember it's likened to a seesaw, when up goes up the other should go down and vice versa.

On Friday the ZN migrated Lower at around 9:45 AM EST as the S&P hit a Low at around the same time.  If you look at the charts below the S&P gave a signal at around 9:45 AM and the ZN started its Downward trend.  Look at the charts below and you'll see a pattern for both assets. S&P hit a Low at around 9:45 AM and migrated Higher.  These charts represent the newest version of MultiCharts and I've changed the timeframe to a 15-minute chart to display better.  This represented a Short opportunity on the 10-year note, as a trader you could have netted about 30 plus ticks per contract on this trade.   Each tick is worth $15.625.  Please note: the front month for the ZN is now Dec '23.  The S&P contract is now Dec' 23.   I've changed the format to filled Candlesticks (not hollow) such that it may be more apparent and visible.  

Charts courtesy of MultiCharts built on an AMP platform

Chart

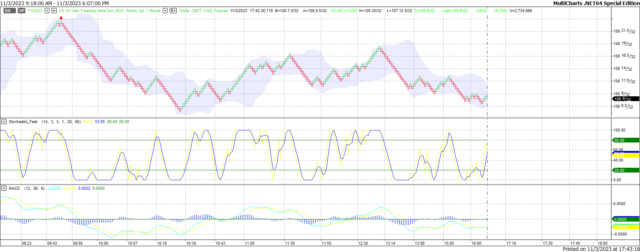
ZN - Dec 2023 - 11/03/23

Chart

S&P - Dec 2023 - 11/03/23

Bias

On Friday we gave the markets a Neutral bias as it was Jobs Friday, and we always maintain a Neutral bias on that day.  The markets soared Higher as the Dow closed 222 points Higher, and the other indices migrated Higher as well.  Today we aren't dealing with a correlated market and our bias is to the Upside. 

Could this change? Of Course. Remember anything can happen in a volatile market. 

Commentary

On Friday the jobs report came out and showed that the US economy created 150,000 new jobs versus 178,000 expected; yet the markets closed Higher.  So what gives?  Why did the markets close Higher?  This entire year we've been saying that as long as the economy shows signs of growth it would compel the Federal Reserve to hike rates so as to slow down the economy.  Not meeting a job creation expectation doesn't show signs of growth, it shows contraction so the markets felt this would make the Fed pause as opposed to hiking rates and the markets took off.  Will this continue today?  Only time will tell.

Trading performance displayed herein is hypothetical. The following Commodity Futures Trading Commission (CFTC) disclaimer should be noted.

Hypothetical performance results have many inherent limitations, some of which are described below. No representation is being made that any account will or is likely to achieve profits or losses similar to those shown.

In fact, there are frequently sharp differences between hypothetical performance results and the actual results subsequently achieved by any particular trading program. One of the limitations of hypothetical performance trading results is that they are generally prepared with the benefit of hindsight.

In addition, hypothetical trading does not involve financial risk, and no hypothetical trading record can completely account for the impact of financial risk in actual trading. For example, the ability to withstand losses or to adhere to a particular trading program in spite of trading losses are material points which can also adversely affect actual trading results.

There are numerous other factors related to the markets in general or to the implementation of any specific trading program which cannot be fully accounted for in the preparation of hypothetical performance results and all of which can adversely affect actual trading results.

Trading in the commodities markets involves substantial risk and YOU CAN LOSE A LOT OF MONEY, and thus is not appropriate for everyone. You should carefully consider your financial condition before trading in these markets, and only risk capital should be used.

In addition, these markets are often liquid, making it difficult to execute orders at desired prices. Also, during periods of extreme volatility, trading in these markets may be halted due to so-called “circuit breakers” put in place by the CME to alleviate such volatility. In the event of a trading halt, it may be difficult or impossible to exit a losing position.

Recommended Content


Recommended Content

Editors’ Picks

EUR/USD breaks below 1.1000 on stellar NFP

EUR/USD breaks below 1.1000 on stellar NFP

The buying bias in the Greenback gathers extra pace on Friday after the US economy created far more jobs than initially estimated in September, dragging EUR/USD to the area of new lows near 1.0950.

EUR/USD News
GBP/USD breaches 1.3100 after encouraging US Payrolls

GBP/USD breaches 1.3100 after encouraging US Payrolls

The continuation of the uptrend in the US Dollar motivates GBP/USD to accelerates its losses and breaches 1.3100 the figure in the wake of the release of US NFP.

GBP/USD News
Gold rebounds from daily lows and flirts with $2,670

Gold rebounds from daily lows and flirts with $2,670

Following a post-NFP dip to the $2,640 region, Gold prices now embarks on an acceptable rebound and retest the area of $2,670 per ounce troy despite the marked advance in the US Dollar and rising US yields across the board.

Gold News
US Payrolls surge in September, as 50bp rate cut ruled out

US Payrolls surge in September, as 50bp rate cut ruled out

US payrolls data surprised on the upside in September, rising by 254k, smashing expectations of a 150k rise. The unemployment rate fell to 4.1% from 4.2%, average hourly earnings increased to a 4% YoY rate and there was a 72k upwards revision to the previous two months’ payrolls numbers.

Read more
RBA widely expected to keep key interest rate unchanged amid persisting price pressures

RBA widely expected to keep key interest rate unchanged amid persisting price pressures

The Reserve Bank of Australia is likely to continue bucking the trend adopted by major central banks of the dovish policy pivot, opting to maintain the policy for the seventh consecutive meeting on Tuesday.

Read more
Five best Forex brokers in 2024

Five best Forex brokers in 2024

VERIFIED Choosing the best Forex broker in 2024 requires careful consideration of certain essential factors. With the wide array of options available, it is crucial to find a broker that aligns with your trading style, experience level, and financial goals. 

Read More

Majors

Cryptocurrencies

Signatures