USD: Sept '24 is Up at 101.760.

Energies: Oct '24 Crude is Down at 72.20.

Financials: The Dec '24 30 Year T-Bond is Up 1 tick and trading at 123.05.

Indices: The Sept '24 S&P 500 emini ES contract is 128 ticks Lower and trading at 5629.00.

Gold: The Dec'24 Gold contract is trading Up at 2531.00.

Initial conclusion

This is not a correlated market.  The USD is Up and Crude is Down which is normal, but the 30 Year T-Bond is trading Down.  The Financials should always correlate with the US dollar such that if the dollar is Higher, then the bonds should follow and vice-versa. The S&P is Lower and Crude is trading Lower which is not correlated. Gold is trading Higher which is not correlated with the US dollar trading Up.  I tend to believe that Gold has an inverse relationship with the US Dollar as when the US Dollar is down, Gold tends to rise in value and vice-versa. Think of it as a seesaw, when one is up the other should be down. I point this out to you to make you aware that when we don't have a correlated market, it means something is wrong. As traders you need to be aware of this and proceed with your eyes wide open. Currently  Asia traded Lower with the exception of the Aussie and Singapore exchanges.  All of Europe is trading Lower.

Possible challenges to traders

  • Final Manufacturing PMI is out at 9:45 AM EST.  This is Major.

  • ISM Manufacturing PMI is out at 10 AM EST.  This is Major.

  • ISM Manufacturing Prices is out at 10 AM EST.  This is Major.

  • Chicago PMI is out at 9:45 AM EST.  This is Major.

  • Construction Spending m/m is out at 10 AM EST.  This is Major.

  • RCM/TIPP Economic Optimism is tentative.  This is Major.

Traders, please note that we've changed the Bond instrument from the 10 year (ZN) to the 2 year (ZT).  They work exactly the same.  

We've elected to switch gears a bit and show correlation between the 2-year Treasury notes (ZT) and the S&P futures contract.  The YM contract is the Dow Jones Industrial Average, and the purpose is to show reverse correlation between the two instruments.  Remember it's likened to a seesaw, when up goes up the other should go down and vice versa.

Last Friday the ZT migrated Lower at around 8:30 AM EST after the Income and Spending numbers were released and began its Downward slide.  Look at the charts below and you'll see a pattern for both assets. The Dow moved Higher at 8:30 AM and the ZT moved Lower at around the same time.  These charts represent the newest version of BarCharts, and I've changed the timeframe to a 15-minute chart to display better.  This represented a Short opportunity on the 2-year note, as a trader you could have netted about 30 ticks per contract on this trade.   Each tick is worth $7.625.  Please note: the front month for ZT is Dec and the Dow is still Sept '24.  I've changed the format to filled Candlesticks (not hollow) such that it may be more apparent and visible.

Charts courtesy of Barcharts

Chart

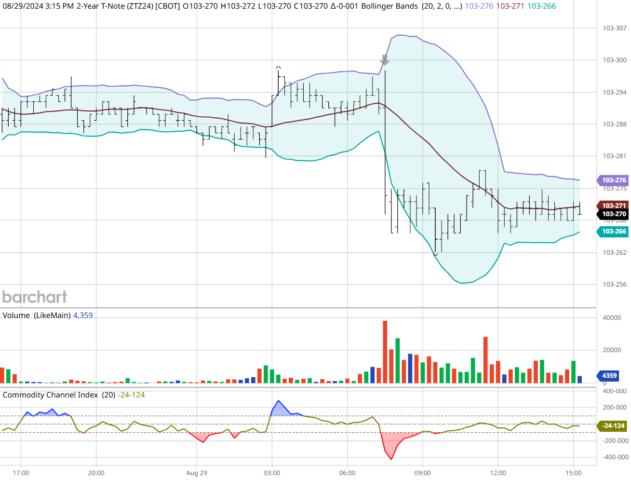
ZT -Dec 2024 - 08/30/24

Chart

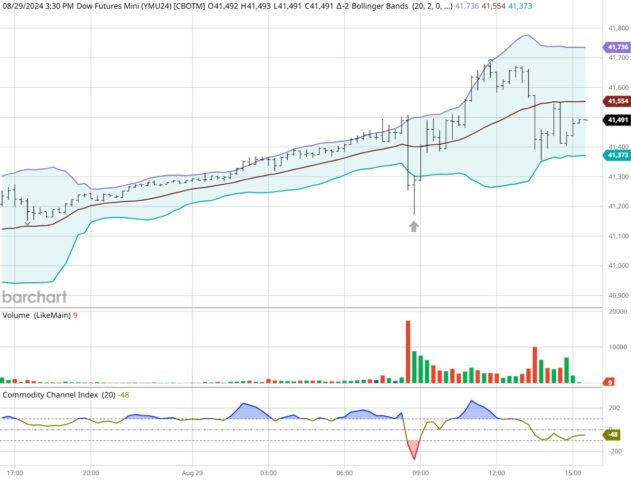
Dow - Sept 2024- 08/30/24

Bias

Last Friday we gave the markets an Upside bias as we finally saw some correlation between crude and the indices.  The markets rose and the Dow closed  228 points HIgher an dteh other indices gained ground as well.  Today we aren't dealing with a correlated market and our bias is to the Downside.

Could this change? Of Course.  Remember anything can happen in a volatile market. 

Commentary

Last Thursday evening the world got a glimpse of what an administration under President Harris would be like.  The problem was no one thought the interview was outstanding as VP Harris flip flopped on a number of issues and didn't address that well.  No discussion was made on Women's Rights, the Border or other issues deemed to be important.   The problem is VP Harris will soon debate former President Trump and if she conducts herself as she did last Thursday, he will destroy her.

Trading performance displayed herein is hypothetical. The following Commodity Futures Trading Commission (CFTC) disclaimer should be noted.

Hypothetical performance results have many inherent limitations, some of which are described below. No representation is being made that any account will or is likely to achieve profits or losses similar to those shown.

In fact, there are frequently sharp differences between hypothetical performance results and the actual results subsequently achieved by any particular trading program. One of the limitations of hypothetical performance trading results is that they are generally prepared with the benefit of hindsight.

In addition, hypothetical trading does not involve financial risk, and no hypothetical trading record can completely account for the impact of financial risk in actual trading. For example, the ability to withstand losses or to adhere to a particular trading program in spite of trading losses are material points which can also adversely affect actual trading results.

There are numerous other factors related to the markets in general or to the implementation of any specific trading program which cannot be fully accounted for in the preparation of hypothetical performance results and all of which can adversely affect actual trading results.

Trading in the commodities markets involves substantial risk and YOU CAN LOSE A LOT OF MONEY, and thus is not appropriate for everyone. You should carefully consider your financial condition before trading in these markets, and only risk capital should be used.

In addition, these markets are often liquid, making it difficult to execute orders at desired prices. Also, during periods of extreme volatility, trading in these markets may be halted due to so-called “circuit breakers” put in place by the CME to alleviate such volatility. In the event of a trading halt, it may be difficult or impossible to exit a losing position.

Recommended Content


Recommended Content

Editors’ Picks

EUR/USD stays in daily range near 1.1050 after US data

EUR/USD stays in daily range near 1.1050 after US data

EUR/USD trades in a narrow channel at around 1.1050 in the second half of the day on Tuesday. The data from the US showed that the ISM Manufacturing PMI recovered slightly to 47.2 in August, failing to provide an additional boost to the USD.

EUR/USD News
GBP/USD closes in on 1.3100 following US PMI data

GBP/USD closes in on 1.3100 following US PMI data

GBP/USD stays under bearish pressure on Tuesday and closes in on 1.3100. Although the US Dollar struggles to benefit from the ISM Manufacturing PMI data for August, the risk-averse market atmosphere doesn't allow the pair to stage a rebound.

GBP/USD News
Gold extends correction toward $2,480 area

Gold extends correction toward $2,480 area

Gold continues to stretch lower on Tuesday and trades at its weakest level in nearly two weeks at around $2,480. Although the US Treasury bond yields decline toward 3.8%, XAU/USD struggles to find a foothold amid persistent US Dollar resilience.

Gold News
Crypto Today: Bitcoin, Ethereum lag, XRP back above $0.56 with major announcements in Korea, Japan

Crypto Today: Bitcoin, Ethereum lag, XRP back above $0.56 with major announcements in Korea, Japan

Bitcoin trades at $59,000, Ethereum hovers around $2,500, both note a slight decline in price on Tuesday. XRP tests $0.57 resistance, adds more than 0.5% to its value on the day. 

Read more
Week ahead: US labour data and the BoC rate announcement in focus

Week ahead: US labour data and the BoC rate announcement in focus

With US Federal Reserve Chair Jerome Powell’s recent speech at the Jackson Hole Symposium confirming that it is time to begin easing policy as well as underlining the importance of the jobs market, this week’s jobs data may help determine how the Fed approaches its easing cycle.

Read more
Moneta Markets review 2024: All you need to know

Moneta Markets review 2024: All you need to know

VERIFIED In this review, the FXStreet team provides an independent and thorough analysis based on direct testing and real experiences with Moneta Markets – an excellent broker for novice to intermediate forex traders who want to broaden their knowledge base.

Read More

Majors

Cryptocurrencies

Signatures