Markets take another u turn, lower

USD: Jun '25 is Down at 103.960.
Energies: May '25 Crude is Down at 69.44.
Financials: The Jun '25 30 Year T-Bond is Lower by 26 ticks and trading at 115.10.
Indices: The Jun '25 S&P 500 emini ES contract is 30 ticks Lower and trading at 5752.00
Gold: The Jun'25 Gold contract is trading Up at 3092.20
Initial conclusion
This is not a correlated market. The USD is Down and Crude is Down which is not normal, but the 30 Year T-Bond is trading Lower. The Financials should always correlate with the US dollar such that if the dollar is Higher, then the bonds should follow and vice-versa. The S&P is Lower and Crude is trading Up which is correlated. Gold is trading Higher which is not correlated with the US dollar trading Up. I tend to believe that Gold has an inverse relationship with the US Dollar as when the US Dollar is down, Gold tends to rise in value and vice-versa. Think of it as a seesaw, when one is up the other should be down. I point this out to you to make you aware that when we don't have a correlated market, it means something is wrong. As traders you need to be aware of this and proceed with your eyes wide open. All of Asia traded Higher except the Aussie and the Nikkei exchanges. All of Europe is trading Lower with the exception of the London exchange which is Higher.
Possible Challenges to Traders
-
Unemployment Claims are out at 8:30 AM EST. This is Major.
-
Final GDP q/q is out at 8:30 AM EST. This is Major.
-
Final GDP Price Index q/q is out at 8:30 AM EST. This is Major.
-
Goods Trade Balance is out at 8:30 AM EST. This is Major.
-
Prelim Wholesale Inventories m/m is out at 8:30 AM EST. This is Major.
-
Pending Home Sales is out at 10 AM EST. This is Major.
-
Natural Gas Storage is out at 10:30 AM EST. This is Major.
Traders, please note that we've changed the Bond instrument from the 10 Year (ZN) to the 2 Year (ZT). They work exactly the same.
We've elected to switch gears a bit and show correlation between the 2-year Treasury notes (ZT) and the S&P futures contract. The YM contract is the Dow Jones Industrial Average, and the purpose is to show reverse correlation between the two instruments. Remember it's likened to a seesaw, when up goes up the other should go down and vice versa.
Yesterday the ZT veered Lower at around 8:30 AM EST with Durable Goods pending at that time. The Dow moved Higher at the same time. Look at the charts below and you'll see a pattern for both assets. The Dow moved Higher at 8:30 AM EST and the ZT moved Lower at around the same time. These charts represent the newest version of Bar Charts, and I've changed the timeframe to a 15-minute chart to display better. This represented a Short opportunity on the 2-year note, as a trader you could have netted about a dozen plus ticks per contract on this trade. Each tick is worth $6.25. Please note: the front month for ZT is now Jun '25 and the Dow is Jun '25 as well. I've changed the format to filled Candlesticks (not hollow) such that it may be more apparent and visible.
Charts courtesy of BarCharts
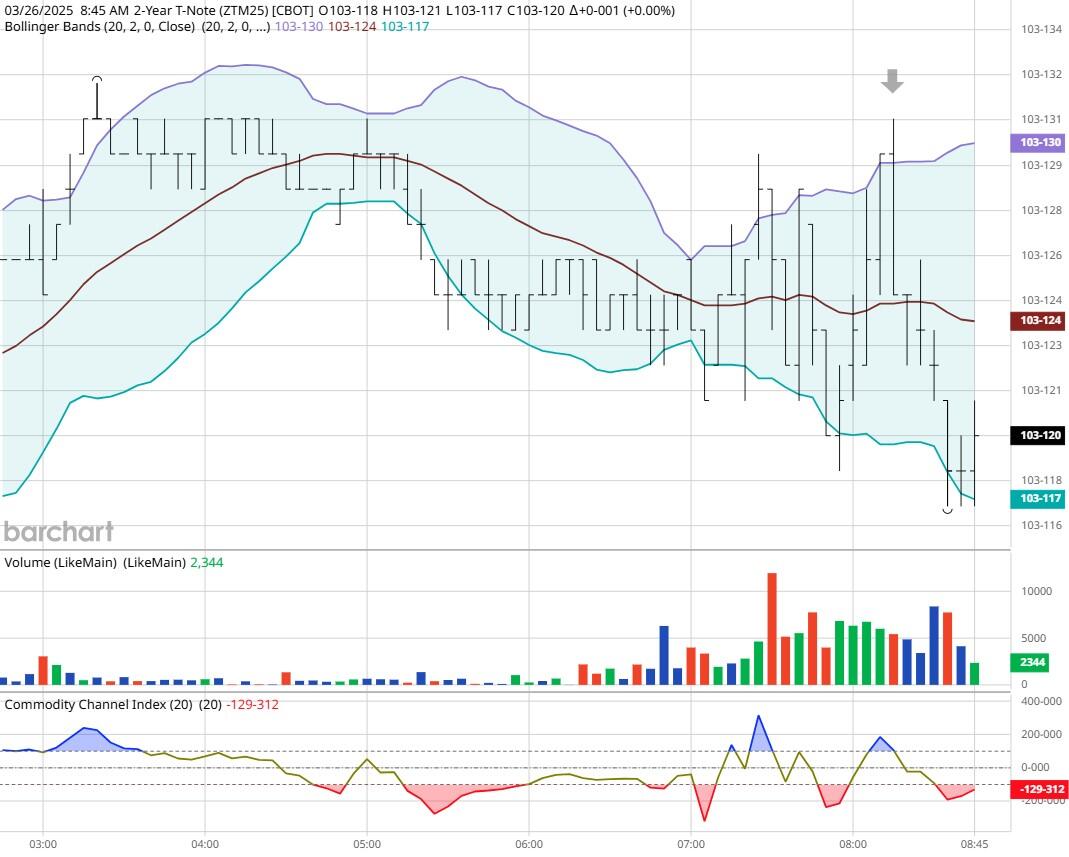
ZT -Jun 2025 - 3/26/25
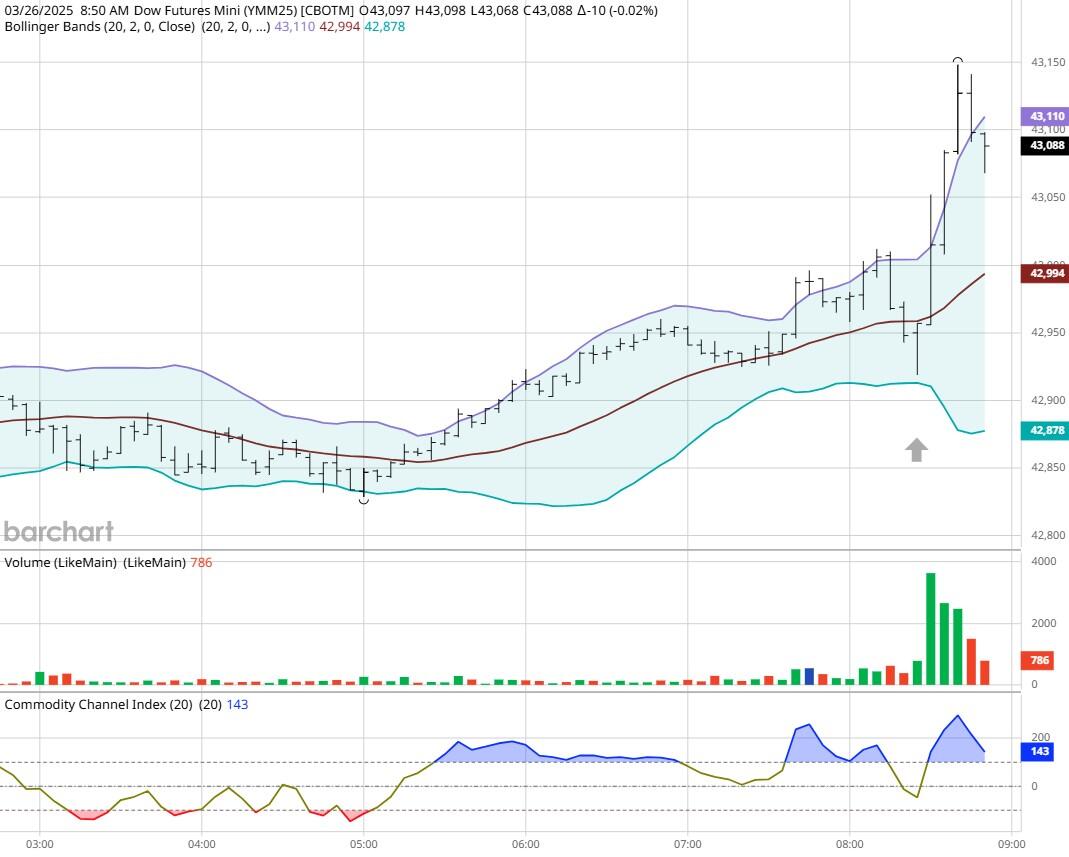
Dow - Mar 2025- 3/26/25
Bias
Yesterday we gave the markets a Neutral or Mixed bias as we didn't see much in the way of correlation Wednesday morning. The markets closed Lower. The Dow closed Lower by 198 points and the other indices closed Lower as well. Today we aren't dealing with a correlated market, and our bias is to the Upside.
Could this change? Of Course. Remember anything can happen in a volatile market.
Commentary
Yesterday the airwaves were once again consumed by the report that the new Secretary of Defense put a reporter on a chat that mentioned war plans on terrorists in the Mid East. That same reporter came out on TV and explained all the information divulged. This was in contrast to what the administration said was no nothing news. Want to learn Market Correlation and determine market direction hours before the Opening Bell?
Author

Nick Mastrandrea
Market Tea Leaves


