USD: Jun '25 is Down at 99.245.  

Energies: May '25 Crude is Up at 62.16.

Financials: The Jun '25 30 Year T-Bond is Higher by 12 ticks and trading at 113.18.

Indices: The Jun '25 S&P 500 emini ES contract is 284 ticks Higher and trading at 5461.00.

Gold: The Jun'25 Gold contract is trading Down at 3229.20.

Initial conclusion

This is not a correlated market.  The USD is Down and Crude is Up which is normal, but the 30 Year T-Bond is trading Higher.  The Financials should always correlate with the US dollar such that if the dollar is Higher, then the bonds should follow and vice-versa. The S&P is Higher and Crude is trading Higher which is not correlated. Gold is trading Lower which is not correlated with the US dollar trading Down.  I tend to believe that Gold has an inverse relationship with the US Dollar as when the US Dollar is down, Gold tends to rise in value and vice-versa. Think of it as a seesaw, when one is up the other should be down. I point this out to you to make you aware that when we don't have a correlated market, it means something is wrong. As traders you need to be aware of this and proceed with your eyes wide open. Asia traded Mixed.  All of Europe is trading Higher.

Possible challenges to traders

  • FOMC Member Barkin Speaks at 12 noon EST.  This is Major.
  • FOMC Member Waller Speaks at 1 PM EST.  This is Major.

Traders, please note that we've changed the Bond instrument from the 10 Year (ZN) to the 2 Year (ZT).  They work exactly the same.

We've elected to switch gears a bit and show correlation between the 2-year Treasury notes (ZT) and the S&P futures contract.  The YM contract is the Dow Jones Industrial Average, and the purpose is to show reverse correlation between the two instruments.  Remember it's likened to a seesaw, when up goes up the other should go down and vice versa.

On Friday the ZT dived Lower at around 8:30 AM EST with PPI numbers waiting in the wings.  The Dow moved Higher at the same time.  Look at the charts below and you'll see a pattern for both assets. The Dow moved Higher at 8:30 AM EST and the ZT moved Lower at around the same time.  These charts represent the newest version of Bar Charts, and I've changed the timeframe to a 15-minute chart to display better.  This represented a Short opportunity on the 2-year note, as a trader you could have netted about 30 plus ticks per contract on this trade.   Each tick is worth $6.25.  Please note: the front month for ZT is now Jun '25 and the Dow is Jun '25 as well.  I've changed the format to filled Candlesticks (not hollow) such that it may be more apparent and visible.

Charts courtesy of bar charts 

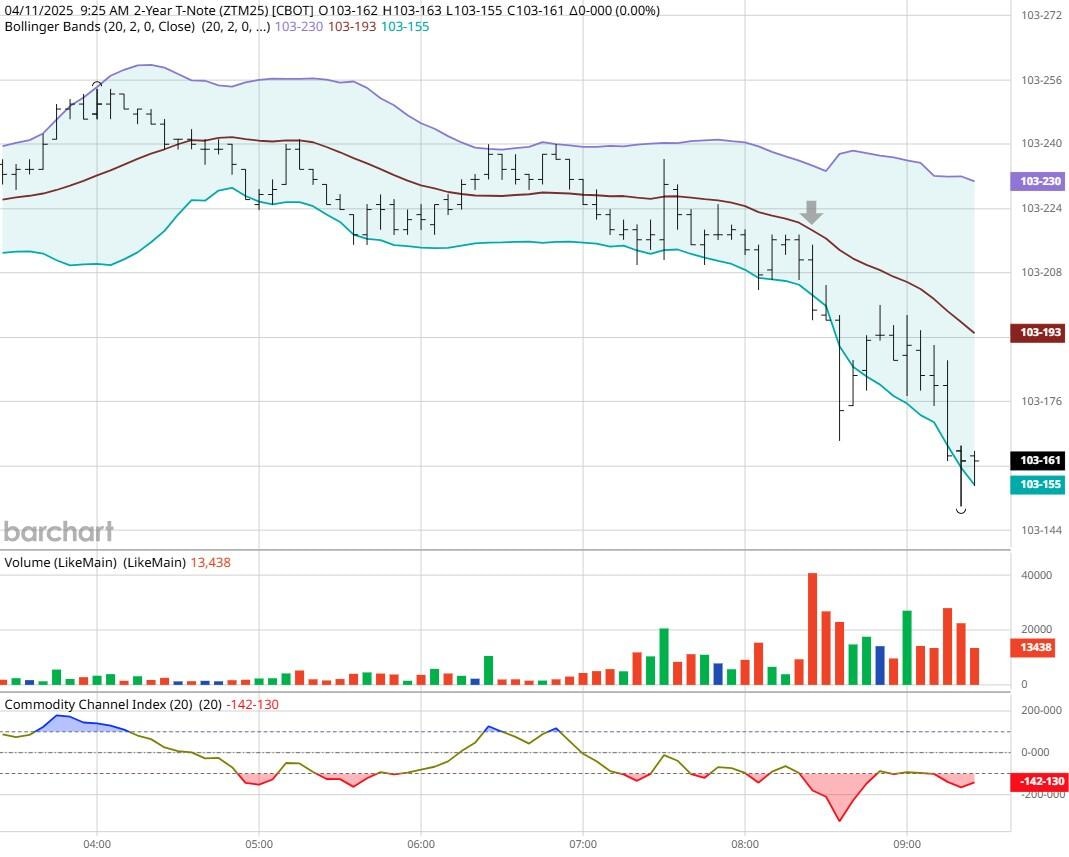
ZT -Jun 2025 - 4/11/25

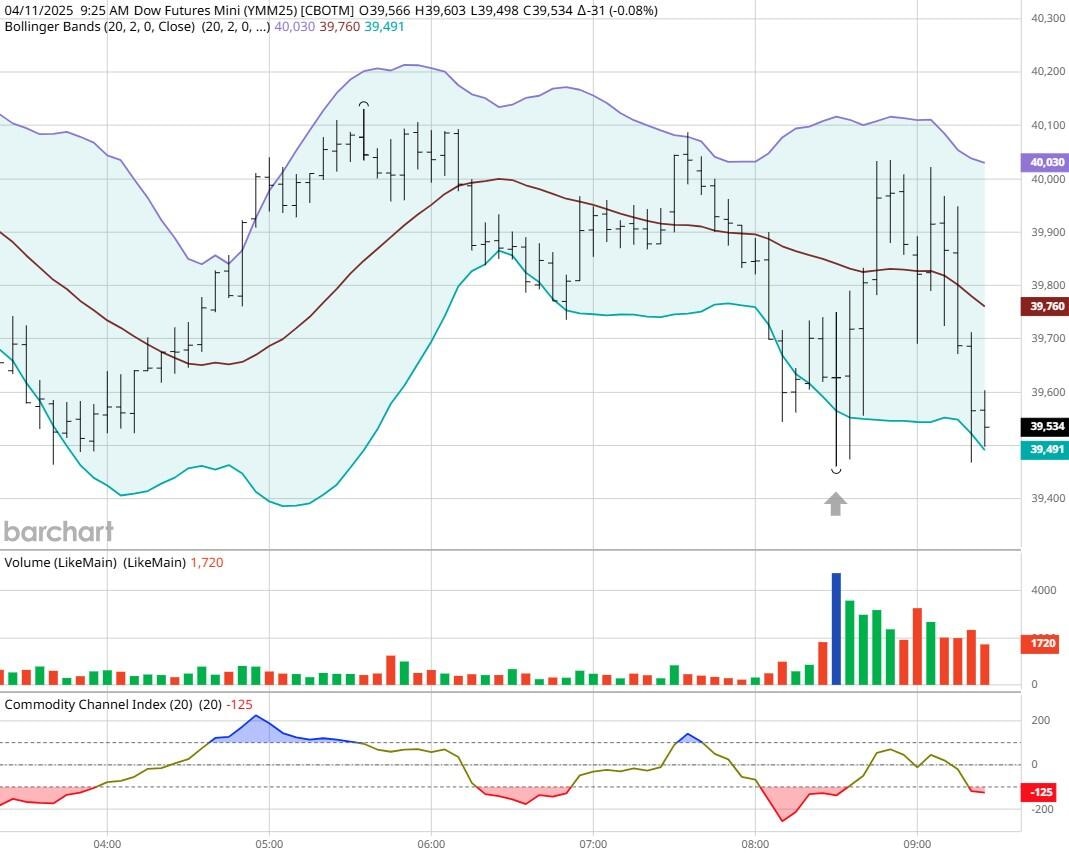
Dow - Mar 2025- 4/11/25

Bias

Yesterday we gave the markets an Upside bias and the markets didn't disappoint as the USD was trading Lower Friday morning.  The Dow gained 620 points on the session and the other indices closed Higher as well.  Today we aren't dealing with a correlated market and our bias is to the Upside.

Could this change? Of Course.  Remember anything can happen in a volatile market.

Commentary

On Friday we're seeing the situation of one day down, next day up or vice versa.  Thats okay as long as it works but from our perspective, we will continue to do our homework and analyze the markets on a day-by-day basis.  On Friday we did so, and our analysis said the markets would go Higher on the day and it did.  We take nothing for granted and we don't assume the markets will do something without first analyzing the situation.

Trading performance displayed herein is hypothetical. The following Commodity Futures Trading Commission (CFTC) disclaimer should be noted.

Hypothetical performance results have many inherent limitations, some of which are described below. No representation is being made that any account will or is likely to achieve profits or losses similar to those shown.

In fact, there are frequently sharp differences between hypothetical performance results and the actual results subsequently achieved by any particular trading program. One of the limitations of hypothetical performance trading results is that they are generally prepared with the benefit of hindsight.

In addition, hypothetical trading does not involve financial risk, and no hypothetical trading record can completely account for the impact of financial risk in actual trading. For example, the ability to withstand losses or to adhere to a particular trading program in spite of trading losses are material points which can also adversely affect actual trading results.

There are numerous other factors related to the markets in general or to the implementation of any specific trading program which cannot be fully accounted for in the preparation of hypothetical performance results and all of which can adversely affect actual trading results.

Trading in the commodities markets involves substantial risk and YOU CAN LOSE A LOT OF MONEY, and thus is not appropriate for everyone. You should carefully consider your financial condition before trading in these markets, and only risk capital should be used.

In addition, these markets are often liquid, making it difficult to execute orders at desired prices. Also, during periods of extreme volatility, trading in these markets may be halted due to so-called “circuit breakers” put in place by the CME to alleviate such volatility. In the event of a trading halt, it may be difficult or impossible to exit a losing position.

Recommended Content


Recommended Content

Editors’ Picks

EUR/USD stabilizes above 1.1350 on Easter Friday

EUR/USD stabilizes above 1.1350 on Easter Friday

EUR/USD enters a consolidation phase above 1.1350 on Friday as the trading action remains subdued, with major markets remaining closed in observance of the Easter Holiday. On Thursday, the European Central Bank (ECB) announced it cut key rates by 25 bps, as expected.

EUR/USD News
GBP/USD fluctuates below 1.3300, looks to post weekly gains

GBP/USD fluctuates below 1.3300, looks to post weekly gains

After setting a new multi-month high near 1.3300 earlier in the week, GBP/USD trades in a narrow band at around 1.32700 on Friday and remains on track to end the week in positive territory. Markets turn quiet on Friday as trading conditions thin out on Easter Holiday.

GBP/USD News
Gold ends week with impressive gains above $3,300

Gold ends week with impressive gains above $3,300

Gold retreated slightly from the all-time high it touched at $3,357 early Thursday but still gained more than 2% for the week after settling at $3,327. The uncertainty surrounding US-China trade relations caused markets to adopt a cautious stance, boosting safe-haven demand for Gold.

Gold News
How SEC-Ripple case and ETF prospects could shape XRP’s future

How SEC-Ripple case and ETF prospects could shape XRP’s future

Ripple consolidated above the pivotal $2.00 level while trading at $2.05 at the time of writing on Friday, reflecting neutral sentiment across the crypto market. 

Read more
Future-proofing portfolios: A playbook for tariff and recession risks

Future-proofing portfolios: A playbook for tariff and recession risks

It does seem like we will be talking tariffs for a while. And if tariffs stay — in some shape or form — even after negotiations, we’ll likely be talking about recession too. Higher input costs, persistent inflation, and tighter monetary policy are already weighing on global growth. 

Read more
The Best brokers to trade EUR/USD

The Best brokers to trade EUR/USD

SPONSORED Discover the top brokers for trading EUR/USD in 2025. Our list features brokers with competitive spreads, fast execution, and powerful platforms. Whether you're a beginner or an expert, find the right partner to navigate the dynamic Forex market.

Read More

Majors

Cryptocurrencies

Signatures

Best Brokers of 2025