Markets steam ahead [Video]
![Markets steam ahead [Video]](https://editorial.fxstreet.com/images/TechnicalAnalysis/Intermarket/Correlation/it-must-work-gm537868515-58464346_XtraLarge.jpg)
US Dollar: Mar '23 USD is Down at 101.810.
Energies: Feb '23 Crude is Up at 81.83.
Financials: The Mar '23 30 Year T-Bond is Up 14 ticks and trading at 130.09.
Indices: The Mar '23 S&P 500 emini ES contract is 44 ticks Lower and trading at 4025.50.
Gold: The Feb'23 Gold contract is trading Up at 1938.30. Gold is 97 ticks Higher than its close.
Initial conclusion
This is a nearly correlated market. The dollar is Down, and Crude is Up which is normal, but the 30 Year T-Bond is trading Higher. The Financials should always correlate with the US dollar such that if the dollar is lower, then the bonds should follow and vice-versa. The S&P is Lower, and Crude is trading Higher which is correlated. Gold is trading Higher which is correlated with the US dollar trading Down. I tend to believe that Gold has an inverse relationship with the US Dollar as when the US Dollar is down, Gold tends to rise in value and vice-versa. Think of it as a seesaw, when one is up the other should be down. I point this out to you to make you aware that when we don't have a correlated market, it means something is wrong. As traders you need to be aware of this and proceed with your eyes wide open. Currently all of Asia is trading Higher. Europe however is trading Lower at the present time.
Possible challenges to traders today
-
Flash Services PMI is out at 9:45 AM EST. This is Major.
-
Flash Manufacturing PMI is out at 9:45 AM EST. Major.
-
Richmond Manufacturing Index is out at 10 AM EST. Major.
Treasuries
Traders, please note that we've changed the Bond instrument from the 30 year (ZB) to the 10 year (ZN). They work exactly the same.
We've elected to switch gears a bit and show correlation between the 10-year bond (ZN) and the S&P futures contract. The S&P contract is the Standard and Poor's, and the purpose is to show reverse correlation between the two instruments. Remember it's likened to a seesaw, when up goes up the other should go down and vice versa.
Yesterday the ZN hit a High at around 11 AM EST. The S&P was trading Lower at around the same time. If you look at the charts below ZN gave a signal at around 11 AM and the S&P gave a signal at around the same time. Look at the charts below and you'll see a pattern for both assets. ZN hit a High at around 11 AM and migrated Lower. These charts represent the newest version of MultiCharts and I've changed the timeframe to a 15-minute chart to display better. This represented a Short opportunity on the 10-year note, as a trader you could have netted about 20 ticks per contract on this trade. Each tick is worth $15.625. Please note: the front month for the ZN is now Mar '23. The S&P contract is now Mar' 23 as well. I've changed the format to filled Candlesticks (not hollow) such that it may be more apparent and visible.
Charts courtesy of MultiCharts built on an AMP platform
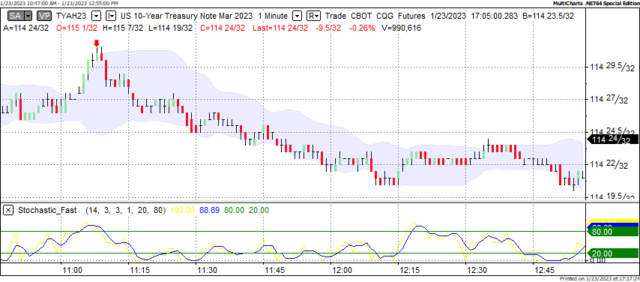
ZN - Mar 2023 - 1/23/23
-638101638912520488.png)
S&P - Mar 2023 - 1/23/23
Bias
Yesterday we gave the markets a Neutral bias as we didn't see much in the way of market correlation Monday morning, hence the Neutral bias. The Dow gained 254 points on the session and the other indices traded Higher as well. Today we're dealing with a nearly correlated market and our bias is to the Downside.
Could this change? Of Course. Remember anything can happen in a volatile market.
Commentary
On Friday the markets exploded to the Upside as the Dow gained over 300 points on the session. The other indices gained ground as well so overall it was an Upside Day. However, Friday after 4 PM the global markets are closed fort the weekends and have no opportunity to follow the US markets and trade Higher. Fast forward to Monday morning the overseas markets are trading Higher in order to follow Friday's market footprint. There's no real economic news to drive the markets in one direction or another so what happens? The US markets now follow the global trend and trade Higher. Is this a theory or real? As in all things only time will tell.
Author

Nick Mastrandrea
Market Tea Leaves


