USD: Dec '23 is Down at 106.050.

Energies: Dec '23 Crude is Down at 87.55.

Financials: The Dec '23 30 Year T-Bond is Up 35 ticks and trading at 107.11.

Indices: The Dec '23 S&P 500 emini ES contract is 100 ticks Lower and trading at 4223.50. 

Gold: The Dec'23 Gold contract is trading Down at 1987.80.  

Initial conclusion

This is not a correlated market. The USD is Down and Crude is Down which is not normal, but the 30 Year T-Bond is trading Higher. The Financials should always correlate with the US dollar such that if the dollar is Higher, then the bonds should follow and vice-versa. The S&P is Lower, and Crude is trading Lower which is not correlated. Gold is trading Lower which is not correlated with the US dollar trading Down. I tend to believe that Gold has an inverse relationship with the US Dollar as when the US Dollar is down, Gold tends to rise in value and vice-versa. Think of it as a seesaw, when one is up the other should be down. I point this out to you to make you aware that when we don't have a correlated market, it means something is wrong. As traders you need to be aware of this and proceed with your eyes wide open.  All of Asia is traded Lower. All of Europe is trading Lower as well.

Possible challenges to traders

  • No Major Economic News to speak of.

  • Lack of Major Economic News.

Treasuries

Traders, please note that we've changed the Bond instrument from the 30 year (ZB) to the 10 year (ZN). They work exactly the same.  

We've elected to switch gears a bit and show correlation between the 10-year bond (ZN) and the S&P futures contract. The S&P contract is the Standard and Poor's, and the purpose is to show reverse correlation between the two instruments. Remember it's likened to a seesaw, when up goes up the other should go down and vice versa.

On Friday the ZN migrated Higher at around 8:30 AM EST as the S&P hit a High at around the same time. If you look at the charts below the S&P gave a signal at around 8:30 AM and the ZN started its Upward trend. Look at the charts below and you'll see a pattern for both assets. S&P hit a High at around 8:30 AM and migrated Lower.  These charts represent the newest version of MultiCharts and I've changed the timeframe to a 15-minute chart to display better. This represented a Long opportunity on the 10-year note, as a trader you could have netted about 30 ticks per contract on this trade. Each tick is worth $15.625. Please note: the front month for the ZN is now Dec '23. The S&P contract is now Dec' 23. I've changed the format to filled Candlesticks (not hollow) such that it may be more apparent and visible.  

Charts courtesy of MultiCharts built on an AMP platform

Chart

ZN - Dec 2023 - 10/20/23

Chart

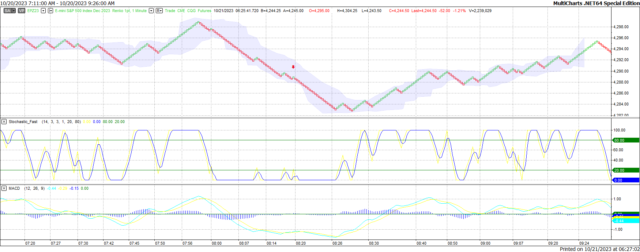
S&P - Dec 2023 - 10/20/23

Bias

Last Friday we gave the markets a Downside bias as both the USD and the bonds were pointed Higher Friday and tis usually reflects a Downside Day. The markets didn't disappoint as the Dow closed Lower by 287 points and the other indices closed Lower as well. Today we aren't dealing with a correlated market and our bias is to the Downside.

Could this change? Of Course.  Remember anything can happen in a volatile market. 

Commentary

Well, it looks like the Fedspeak of Thursday drifted into Friday as the markets continued its Downside trend. The Dow drifted Lower by 287 points and the other indices faltered as well. Perhaps it was the news from DC where the House of Representatives still hasn't picked a Speaker as of yet.  Or maybe it was the news from the Middle East where the Israel-Hamas war is raging. The bottom line is the markets was correlated to the Downside and that's where the markets went on Friday. Today we have no economic news to speak of and certainly nothing major to discuss so once the markets will be left to its own devices.

Trading performance displayed herein is hypothetical. The following Commodity Futures Trading Commission (CFTC) disclaimer should be noted.

Hypothetical performance results have many inherent limitations, some of which are described below. No representation is being made that any account will or is likely to achieve profits or losses similar to those shown.

In fact, there are frequently sharp differences between hypothetical performance results and the actual results subsequently achieved by any particular trading program. One of the limitations of hypothetical performance trading results is that they are generally prepared with the benefit of hindsight.

In addition, hypothetical trading does not involve financial risk, and no hypothetical trading record can completely account for the impact of financial risk in actual trading. For example, the ability to withstand losses or to adhere to a particular trading program in spite of trading losses are material points which can also adversely affect actual trading results.

There are numerous other factors related to the markets in general or to the implementation of any specific trading program which cannot be fully accounted for in the preparation of hypothetical performance results and all of which can adversely affect actual trading results.

Trading in the commodities markets involves substantial risk and YOU CAN LOSE A LOT OF MONEY, and thus is not appropriate for everyone. You should carefully consider your financial condition before trading in these markets, and only risk capital should be used.

In addition, these markets are often liquid, making it difficult to execute orders at desired prices. Also, during periods of extreme volatility, trading in these markets may be halted due to so-called “circuit breakers” put in place by the CME to alleviate such volatility. In the event of a trading halt, it may be difficult or impossible to exit a losing position.

Recommended Content


Recommended Content

Editors’ Picks

AUD/USD: The hunt for the 0.7000 hurdle

AUD/USD: The hunt for the 0.7000 hurdle

AUD/USD quickly left behind Wednesday’s strong pullback and rose markedly past the 0.6900 barrier on Thursday, boosted by news of fresh stimulus in China as well as renewed weakness in the US Dollar.

AUD/USD News
EUR/USD refocuses its attention to 1.1200 and above

EUR/USD refocuses its attention to 1.1200 and above

Rising appetite for the risk-associated assets, the offered stance in the Greenback and Chinese stimulus all contributed to the resurgence of the upside momentum in EUR/USD, which managed to retest the 1.1190 zone on Thursday.

EUR/USD News
Gold holding at higher ground at around $2,670

Gold holding at higher ground at around $2,670

Gold breaks to new high of $2,673 on Thursday. Falling interest rates globally, intensifying geopolitical conflicts and heightened Fed easing bets are the main factors. 

Gold News
Bitcoin displays bullish signals amid supportive macroeconomic developments and growing institutional demand

Bitcoin displays bullish signals amid supportive macroeconomic developments and growing institutional demand

Bitcoin (BTC) trades slightly up, around $64,000 on Thursday, following a rejection from the upper consolidation level of $64,700 the previous day. BTC’s price has been consolidating between $62,000 and $64,700 for the past week.

Read more
RBA widely expected to keep key interest rate unchanged amid persisting price pressures

RBA widely expected to keep key interest rate unchanged amid persisting price pressures

The Reserve Bank of Australia is likely to continue bucking the trend adopted by major central banks of the dovish policy pivot, opting to maintain the policy for the seventh consecutive meeting on Tuesday.

Read more
Five best Forex brokers in 2024

Five best Forex brokers in 2024

VERIFIED Choosing the best Forex broker in 2024 requires careful consideration of certain essential factors. With the wide array of options available, it is crucial to find a broker that aligns with your trading style, experience level, and financial goals. 

Read More

Majors

Cryptocurrencies

Signatures