Markets say yes to the upside
USD: Dec '24 is Up at 100.570.
Energies: Nov '24 Crude is Down at 70.79.
Financials: The Dec '24 30 Year T-Bond is Up 2 ticks and trading at 125.06.
Indices: The Dec '24 S&P 500 emini ES contract is 64 ticks Lower and trading at 5762.00.
Gold: The Dec'24 Gold contract is trading Up at 2639.40.
Initial conclusion
This is not a correlated market. The USD is Up and Crude is Down which is normal, and the 30 Year T-Bond is trading Higher. The Financials should always correlate with the US dollar such that if the dollar is Higher, then the bonds should follow and vice-versa. The S&P is Lower and Crude is trading Lower which is not correlated. Gold is trading Higher which is not correlated with the US dollar trading Up. I tend to believe that Gold has an inverse relationship with the US Dollar as when the US Dollar is down, Gold tends to rise in value and vice-versa. Think of it as a seesaw, when one is up the other should be down. I point this out to you to make you aware that when we don't have a correlated market, it means something is wrong. As traders you need to be aware of this and proceed with your eyes wide open. Currently Asia is trading Higher with the exception of the Singapore exchange. Europe is trading Lower with the exception of the Spanish Ibex exchange.
Possible challenges to traders
-
No Major Economic news to speak of.
-
Lack of economic news.
-
FOMC Member Harker speaks at 2 PM EST. This is Major.
Traders, please note that we've changed the Bond instrument from the 10 year (ZN) to the 2 year (ZT). They work exactly the same.
We've elected to switch gears a bit and show correlation between the 2-year Treasury notes (ZT) and the S&P futures contract. The YM contract is the Dow Jones Industrial Average, and the purpose is to show reverse correlation between the two instruments. Remember it's likened to a seesaw, when up goes up the other should go down and vice versa.
Yesterday the ZT migrated Lower at around 8 AM EST with no real economic news released and began its Downward slide. Look at the charts below and you'll see a pattern for both assets. The Dow moved Higher at 8 AM and the ZT moved Lower at around the same time. These charts represent the newest version of Bar Charts, and I've changed the timeframe to a 15-minute chart to display better. This represented a Short opportunity on the 2-year note, as a trader you could have netted about 30 ticks per contract on this trade. Each tick is worth $7.625. Please note: the front month for ZT is Dec and the Dow is still Sept '24. I've changed the format to filled Candlesticks (not hollow) such that it may be more apparent and visible.
Charts courtesy of Barcharts
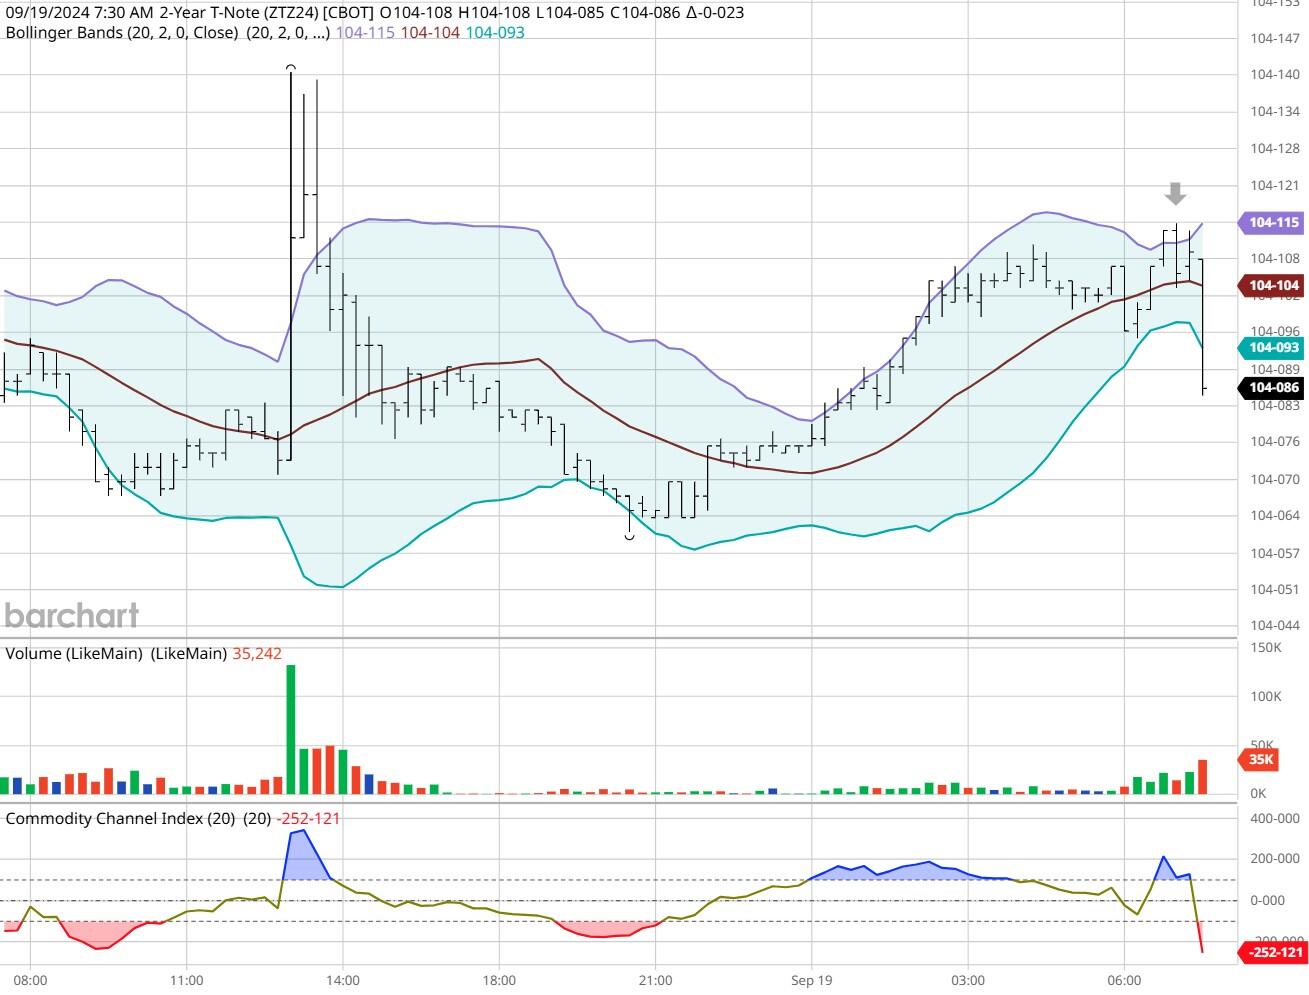
ZT -Dec 2024 - 09/19/24
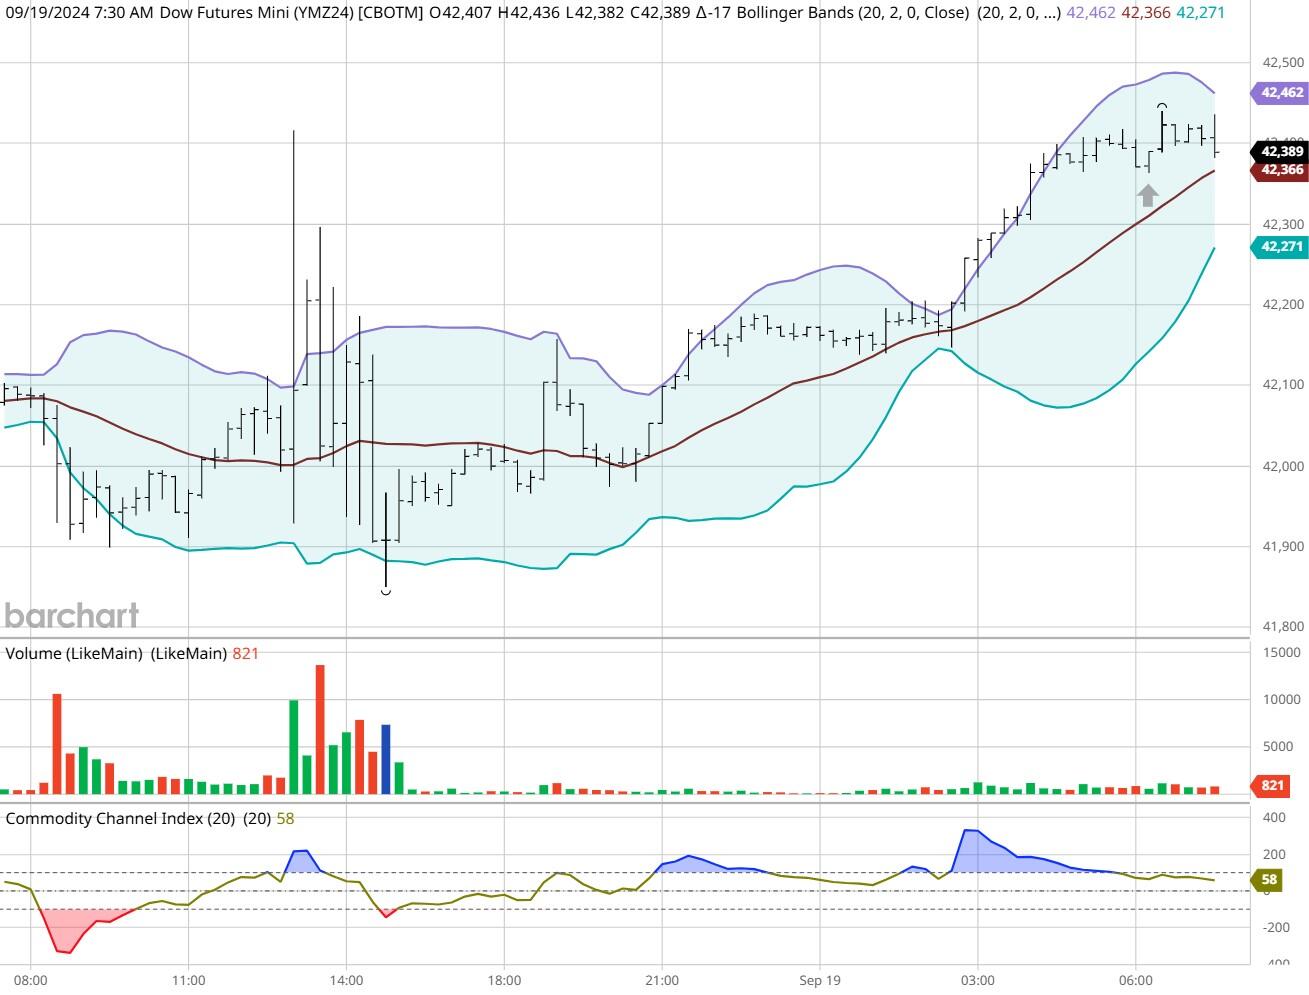
Dow - Dec 2024- 09/19/24
Bias
Yesterday we gave the markets an Upside bias and the markets didn't disappoint as the Dow gained 522 points and the other indices gained ground as well. Today we aren't dealing with a correlated market and our bias is to the Downside.
Could this change? Of Course. Remember anything can happen in a volatile market.
Commentary
On Wednesday the markets closed Lower as there was a general concern that because the Federal Reserve lowered the Federal Funds Rate by 50 basis points then perhaps the economy wasn't doing as well as everyone said. This proved to be untrue and by Thursday the markets marched to an upbeat trend and didn't look back. Today there is no real major economic news with the exception of an FOMC member speaking at 2 PM this afternoon.
Author

Nick Mastrandrea
Market Tea Leaves


