USD: Sept '24 is Down at 102.060.

Energies: Sept '24 Crude is Down at 74.82.

Financials: The Sept '24 30 Year T-Bond is Up 9 ticks and trading at 123.31.

Indices: The Sept '24 S&P 500 emini ES contract is 10 ticks Lower and trading at 5575.75.

Gold: The Dec'24 Gold contract is trading Down at 2582.00.

Initial conclusion

This is not a correlated market.  The USD is Down and Crude is Down which is not normal, but the 30 Year T-Bond is trading Up.  The Financials should always correlate with the US dollar such that if the dollar is Higher, then the bonds should follow and vice-versa. The S&P is Lower and Crude is trading Lower which is not correlated. Gold is trading Lower which is not correlated with the US dollar trading Down.  I tend to believe that Gold has an inverse relationship with the US Dollar as when the US Dollar is down, Gold tends to rise in value and vice-versa. Think of it as a seesaw, when one is up the other should be down. I point this out to you to make you aware that when we don't have a correlated market, it means something is wrong. As traders you need to be aware of this and proceed with your eyes wide open.  Asia trading mainly Mixed.  All of Europe is trading mainly Higher except the London exchange.

Possible challenges to traders

  • FOMC Member Waller Speaks at 9:15 AM EST. This is Major.

  • CB Leading Index m/m is out at 10 AM EST. This is Major.

Traders, please note that we've changed the Bond instrument from the 10 year (ZN) to the 2 year (ZT). They work exactly the same.  

We've elected to switch gears a bit and show correlation between the 10-year Treasury notes (ZN) and the S&P futures contract.  The YM contract is the Dow Jones Industrial Average, and the purpose is to show reverse correlation between the two instruments.  Remember it's likened to a seesaw, when up goes up the other should go down and vice versa.

On Friday the ZT migrated Higher at around 8:30 AM EST. If you look at the charts below the ZT gave a signal at around 8:30 AM after the 8:30 AM reports were released and started its Upward climb.  Look at the charts below and you'll see a pattern for both assets. The Dow moved Lower at 8:30 AM and the ZT moved Higher at around the same time. These charts represent the newest version of BarCharts, and I've changed the timeframe to a 15-minute chart to display better.  This represented a Long opportunity on the 2-year note, as a trader you could have netted about 30 plus ticks per contract on this trade. Each tick is worth $7.625. Please note: the front month for ZT is Sept and the Dow is now Sept '24. I've changed the format to filled Candlesticks (not hollow) such that it may be more apparent and visible.

Charts courtesy of barcharts

ZT

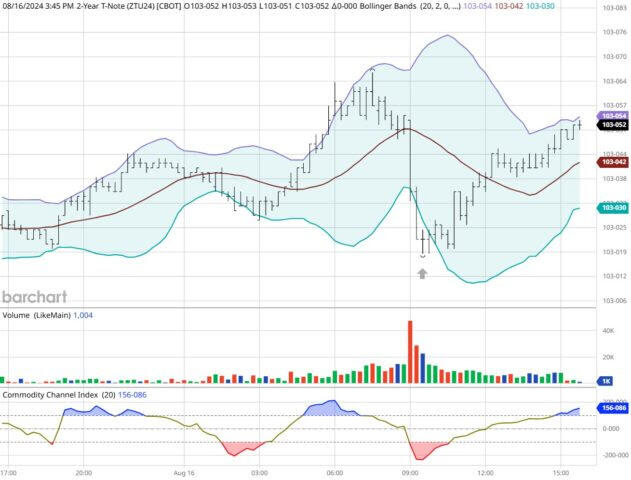
ZT -Sept 2024 - 08/16

Dow

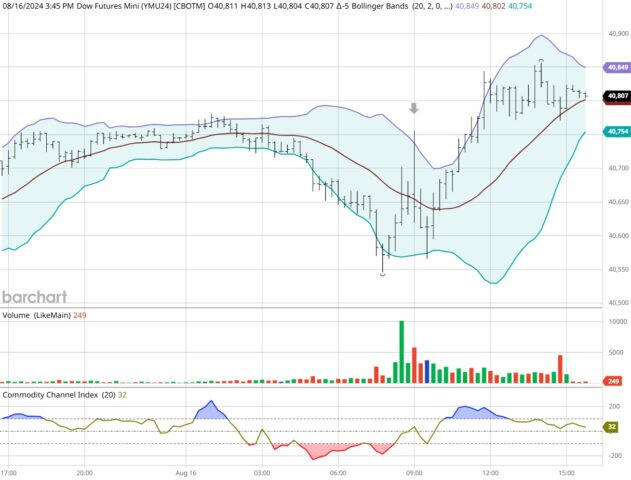
Dow - Sept 2024- 08/16/24

Bias

On Friday we gave the markets a Downside bias as we didn't see any semblance of Market Correlation. The markets had other ideas as the Dow gained 97 points and the other indices gained ground as well.  Today we aren't dealing with a correlated market and our bias is Neutral or Mixed.

Could this change? Of Course. Remember anything can happen in a volatile market. 

Commentary

On Friday we witnessed a continuation of what we saw on Thursday, the markets up on the economic plan and policy of the Democrats. They have promised much for the time ahead but are very light on telling us how all of this will be paid for. The Republicans do the same thing so the question is who will keep their word and who won't. Today we are light on economic news as we only have two reports. Leading Index and an FOMC member speaking.  Today the Democratic National Convention starts so it's now the Dems turn.

Trading performance displayed herein is hypothetical. The following Commodity Futures Trading Commission (CFTC) disclaimer should be noted.

Hypothetical performance results have many inherent limitations, some of which are described below. No representation is being made that any account will or is likely to achieve profits or losses similar to those shown.

In fact, there are frequently sharp differences between hypothetical performance results and the actual results subsequently achieved by any particular trading program. One of the limitations of hypothetical performance trading results is that they are generally prepared with the benefit of hindsight.

In addition, hypothetical trading does not involve financial risk, and no hypothetical trading record can completely account for the impact of financial risk in actual trading. For example, the ability to withstand losses or to adhere to a particular trading program in spite of trading losses are material points which can also adversely affect actual trading results.

There are numerous other factors related to the markets in general or to the implementation of any specific trading program which cannot be fully accounted for in the preparation of hypothetical performance results and all of which can adversely affect actual trading results.

Trading in the commodities markets involves substantial risk and YOU CAN LOSE A LOT OF MONEY, and thus is not appropriate for everyone. You should carefully consider your financial condition before trading in these markets, and only risk capital should be used.

In addition, these markets are often liquid, making it difficult to execute orders at desired prices. Also, during periods of extreme volatility, trading in these markets may be halted due to so-called “circuit breakers” put in place by the CME to alleviate such volatility. In the event of a trading halt, it may be difficult or impossible to exit a losing position.

Recommended Content


Recommended Content

Editors’ Picks

EUR/USD retreats from 2024-high, holds comfortably above 1.1000

EUR/USD retreats from 2024-high, holds comfortably above 1.1000

EUR/USD stages a correction after touching a new 2024-high of 1.1050 but holds comfortably above 1.1000. The cautious market mood limits the US Dollar's losses for the time being and makes it difficult for the pair to push higher.

EUR/USD News

GBP/USD consolidates gains near 1.2950

GBP/USD consolidates gains near 1.2950

GBP/USD struggles to preserve its bullish momentum after setting a monthly high and consolidates daily gains at around 1.2950. In the absence of high-tier data releases, the mixed action seen in Wall Street's main indexes caps the pair's upside.

GBP/USD News

Gold extends correction from record highs, trades below $2,490

Gold extends correction from record highs, trades below $2,490

Gold retreats from the all-time-high it touched at $2,510 on Friday and trades below $2,490 in the American session. The benchmark 10-year US Treasury bond yield holds steady near 3.9% on Monday, not allowing XAU/USD to gain traction.

Gold News

Vitalik Buterin moves 400 Ethereum, ETH hovers around $2,600

Vitalik Buterin moves 400 Ethereum, ETH hovers around $2,600

Vitalik Buterin, co-creator of Ethereum, the largest altcoin in the crypto ecosystem, moved ETH to a crypto mixer, early on Monday. The mixer is known to effectively prevent malicious actors and protect user privacy. 

Read more

Attention shifts to the Fed’s Jackson Hole symposium later this week

Attention shifts to the Fed’s Jackson Hole symposium later this week

Attention shifts to the Fed’s Jackson Hole symposium with a keynote speech by Fed Chair Powell on the economic outlook on Friday. In line with guidance at the July meeting, we think he’ll confirm the likelihood of a September policy rate cut. 

Read more

Moneta Markets review 2024: All you need to know

Moneta Markets review 2024: All you need to know

VERIFIED In this review, the FXStreet team provides an independent and thorough analysis based on direct testing and real experiences with Moneta Markets – an excellent broker for novice to intermediate forex traders who want to broaden their knowledge base.

Read More

Majors

Cryptocurrencies

Signatures