USD: Dec '24 is Up at 100.625.

Energies: Nov '24 Crude is Up at 71.26.

Financials: The Dec '24 30 Year T-Bond is Down 13 ticks and trading at 124.17.

Indices: The Dec '24 S&P 500 emini ES contract is 24 ticks Higher and trading at 5768.00.

Gold: The Dec'24 Gold contract is trading Up at 2647.60.

Initial conclusion

This is not a correlated market.  The USD is Up and Crude is Up which is not normal, but the 30 Year T-Bond is trading Lower.  The Financials should always correlate with the US dollar such that if the dollar is Higher, then the bonds should follow and vice-versa. The S&P is Higher and Crude is trading Higher which is not correlated. Gold is trading Higher which is not correlated with the US dollar trading Up.  I tend to believe that Gold has an inverse relationship with the US Dollar as when the US Dollar is down, Gold tends to rise in value and vice-versa. Think of it as a seesaw, when one is up the other should be down. I point this out to you to make you aware that when we don't have a correlated market, it means something is wrong. As traders you need to be aware of this and proceed with your eyes wide open. Currently Asia is trading Higher with the exception of the Hang Seng exchange.  Europe is trading Mixed. 

Possible challenges to traders

  • FOMC Member Bostic speaks at 8 AM EST.  This is Major.

  • Flash Manufacturing PMI is out at 9:45 AM EST.  This is Major.

  • Flash Services PMI is out at 9:45 AM EST.  This is Major.

  • FOMC Member Goolsbee speaks at 10:15 AM EST.  This is Major.

  • FOMC Member Kashkari speak at 1 PM EST.  This is Major.

Traders, please note that we've changed the Bond instrument from the 10 year (ZN) to the 2 year (ZT).  They work exactly the same.  

We've elected to switch gears a bit and show correlation between the 2-year Treasury notes (ZT) and the S&P futures contract.  The YM contract is the Dow Jones Industrial Average, and the purpose is to show reverse correlation between the two instruments.  Remember it's likened to a seesaw, when up goes up the other should go down and vice versa.

On Friday the ZT migrated Higher at around 8 AM EST with no real economic news released and began its Upward climb.  Look at the charts below and you'll see a pattern for both assets. The Dow moved Lower at 8 AM and the ZT moved Higher at around the same time.  These charts represent the newest version of Bar Charts, and I've changed the timeframe to a 15-minute chart to display better.  This represented a Long opportunity on the 2-year note, as a trader you could have netted about a dozen ticks per contract on this trade.   Each tick is worth $7.625.  Please note: the front month for ZT is Dec and the Dow is still Sept '24.  I've changed the format to filled Candlesticks (not hollow) such that it may be more apparent and visible.

Charts courtesy of Barcharts

Chart

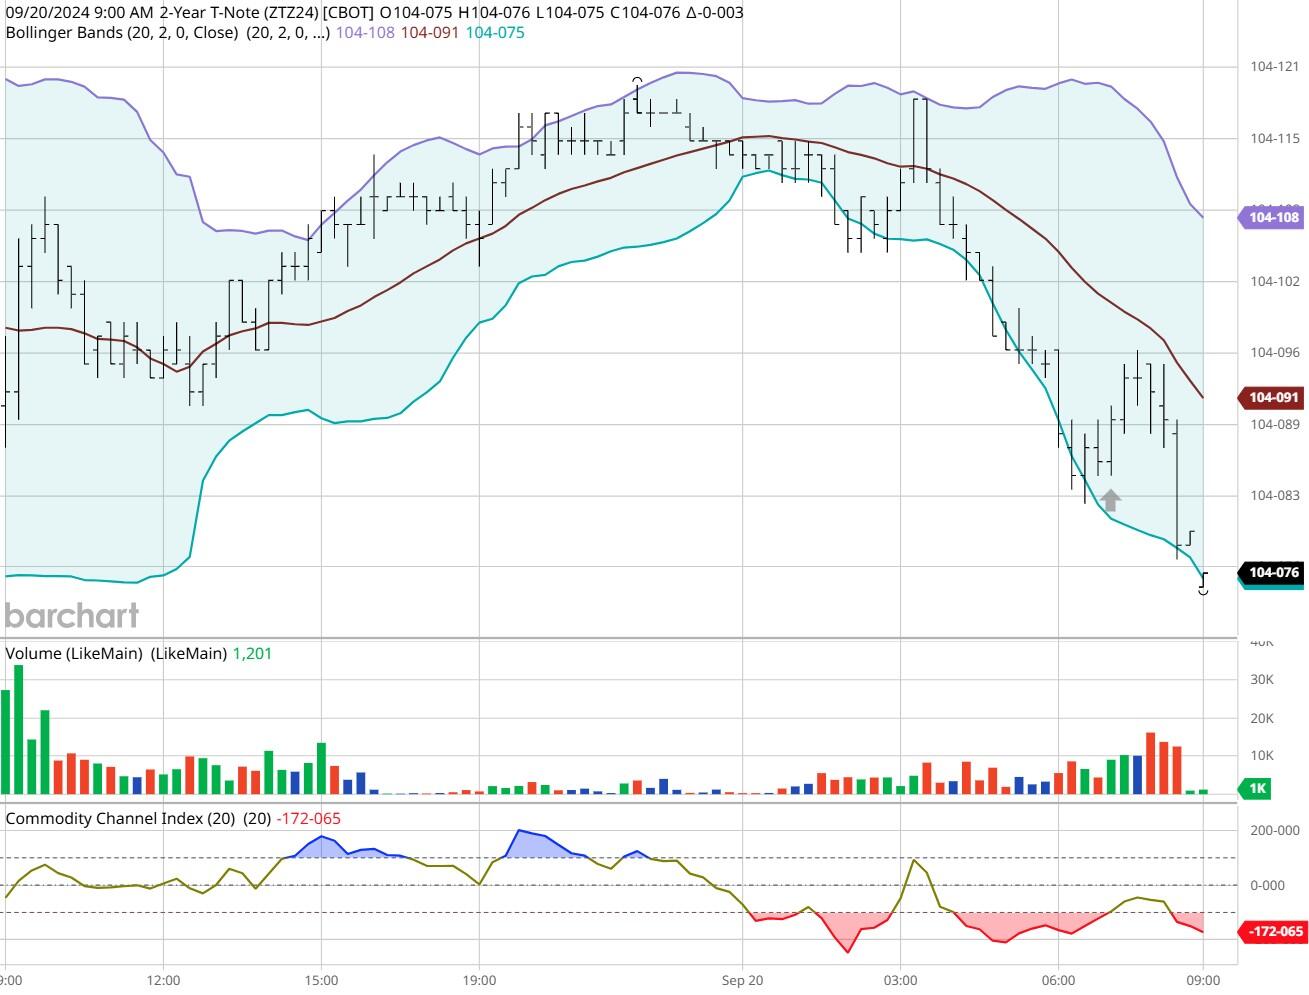
ZT -Dec 2024 - 09/20/24

Chart

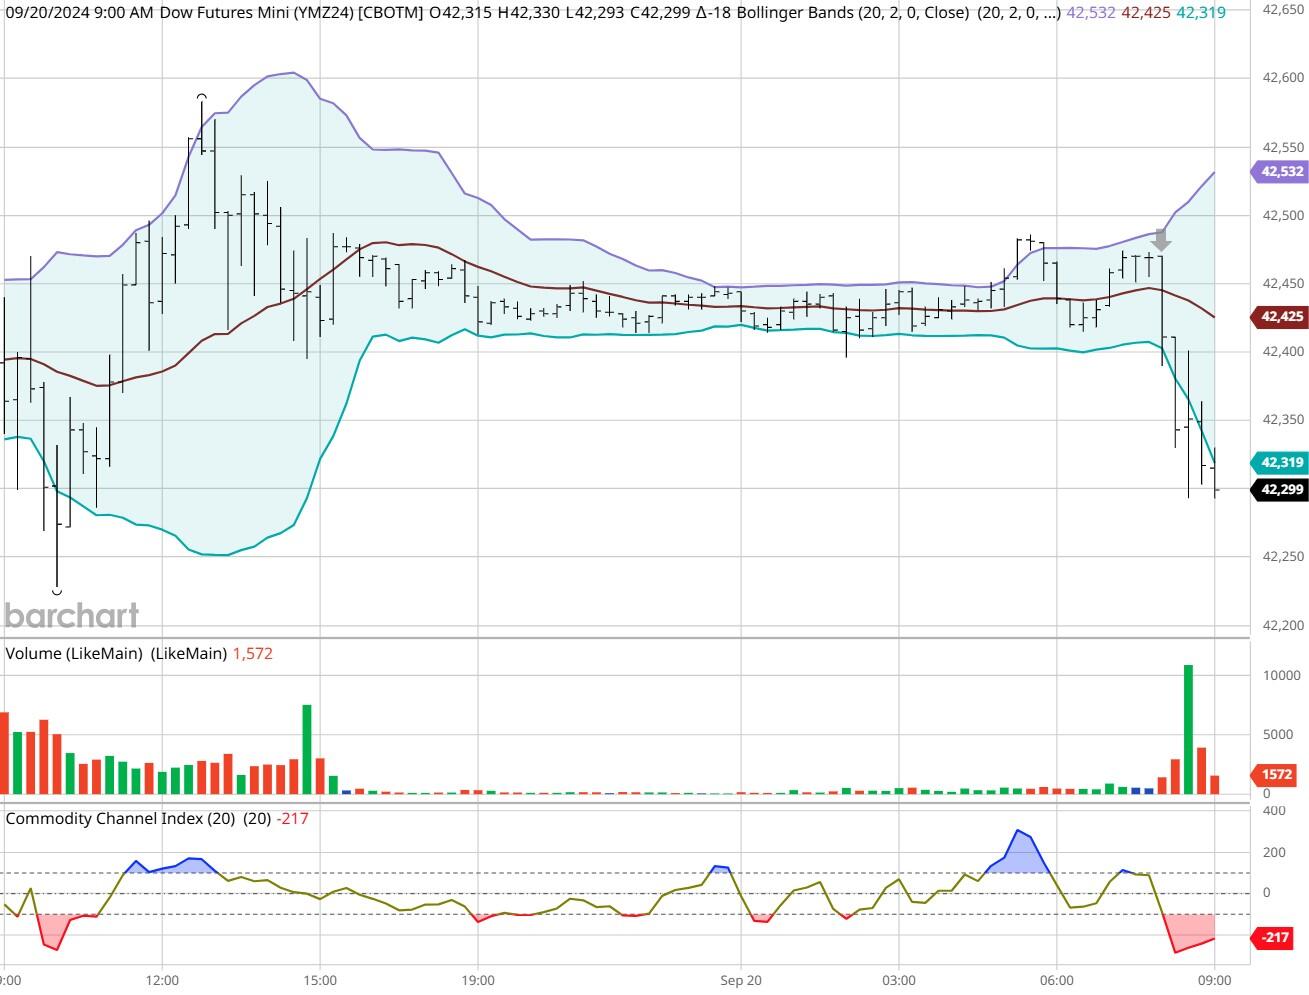
Dow - Dec 2024- 09/20/24

Bias

On Friday we gave the markets a Downside bias and the markets nearly agreed as the Dow closed Higher by 38 points, but the other indices remained true to form and closed Lower.  Today we aren't dealing with a correlated market and our bias is Neutral or Mixed.

Could this change? Of Course. Remember anything can happen in a volatile market. 

Commentary

On Friday we gave the markets a Downside bias and the indices nearly agreed.  The Dow closed Higher by 38 points, but all the other indices closed Lower as expected.  Today we have more economic news is store for us as opposed to Friday which really had nothing.  Today we get the PMI numbers, and we have a number of FOMC members speaking.  I will make particular note of FOMC member Goolsbee.  He was chief consul to President Obama during the fiscal meltdown of 2008 and his actions helped to revive the economy.

Trading performance displayed herein is hypothetical. The following Commodity Futures Trading Commission (CFTC) disclaimer should be noted.

Hypothetical performance results have many inherent limitations, some of which are described below. No representation is being made that any account will or is likely to achieve profits or losses similar to those shown.

In fact, there are frequently sharp differences between hypothetical performance results and the actual results subsequently achieved by any particular trading program. One of the limitations of hypothetical performance trading results is that they are generally prepared with the benefit of hindsight.

In addition, hypothetical trading does not involve financial risk, and no hypothetical trading record can completely account for the impact of financial risk in actual trading. For example, the ability to withstand losses or to adhere to a particular trading program in spite of trading losses are material points which can also adversely affect actual trading results.

There are numerous other factors related to the markets in general or to the implementation of any specific trading program which cannot be fully accounted for in the preparation of hypothetical performance results and all of which can adversely affect actual trading results.

Trading in the commodities markets involves substantial risk and YOU CAN LOSE A LOT OF MONEY, and thus is not appropriate for everyone. You should carefully consider your financial condition before trading in these markets, and only risk capital should be used.

In addition, these markets are often liquid, making it difficult to execute orders at desired prices. Also, during periods of extreme volatility, trading in these markets may be halted due to so-called “circuit breakers” put in place by the CME to alleviate such volatility. In the event of a trading halt, it may be difficult or impossible to exit a losing position.

Recommended Content


Recommended Content

Editors’ Picks

AUD/USD consolidates near 19-month peak as traders await US PCE Price Index

AUD/USD consolidates near 19-month peak as traders await US PCE Price Index

AUD/USD oscillates in a range below the 0.6900 mark, as traders opt to move to the sidelines ahead of the US PCE Price Index. In the meantime, the RBA's hawkish stance, the optimism led by additional monetary stimulus from China, the prevalent risk-on mood, and a bearish USD continue to act as a tailwind for the pair.

AUD/USD News
USD/JPY holds above 145.00 after the Tokyo CPI inflation data

USD/JPY holds above 145.00 after the Tokyo CPI inflation data

The USD/JPY pair attracts some buyers to near 145.20 on Friday during the early Asian session. The pair gains ground near three-week highs after the Tokyo Consumer Price Index. The attention will shift to the US Personal Consumption Expenditures Price Index for August, which is due later on Friday. 

USD/JPY News
Gold price holds steady near record peak; looks to US PCE data from fresh impetus

Gold price holds steady near record peak; looks to US PCE data from fresh impetus

Gold price consolidates below the all-time high set on Thursday amid overbought conditions on the daily chart and the risk-on mood, though dovish Fed expectations continue to act as a tailwind. Bulls, meanwhile, prefer to wait for the release of the US PCE Price Index before placing fresh bets. 

Gold News
Ethereum investors show bullish bias amid ETF inflows and positive funding rates, exchange reserves pose risk

Ethereum investors show bullish bias amid ETF inflows and positive funding rates, exchange reserves pose risk

Ethereum traded around $2,640 on Thursday, up more than 2% following increased bullish bias among investors, as evidenced by ETH ETF net inflows and an uptrend in funding rates. However, investors may be wary of a potential correction from ETH's rising exchange reserve.

Read more
RBA widely expected to keep key interest rate unchanged amid persisting price pressures

RBA widely expected to keep key interest rate unchanged amid persisting price pressures

The Reserve Bank of Australia is likely to continue bucking the trend adopted by major central banks of the dovish policy pivot, opting to maintain the policy for the seventh consecutive meeting on Tuesday.

Read more
Five best Forex brokers in 2024

Five best Forex brokers in 2024

VERIFIED Choosing the best Forex broker in 2024 requires careful consideration of certain essential factors. With the wide array of options available, it is crucial to find a broker that aligns with your trading style, experience level, and financial goals. 

Read More

Majors

Cryptocurrencies

Signatures