Markets had other ideas

USD: Sept '24 is Up at 104.120.
Energies: Aug '24 Crude is Down at 78.03.
Financials: The Sept '24 30 Year T-Bond is Up 8 ticks and trading at 118.28
Indices: The Sept '24 S&P 500 emini ES contract is 184 ticks Higher and trading at 5487.25.
Gold: The Aug'24 Gold contract is trading Up at 2372.10
Initial Conclusion
This is not a correlated market. The USD is Up and Crude is Down which is normal, and the 30 Year T-Bond is trading Up. The Financials should always correlate with the US dollar such that if the dollar is Higher, then the bonds should follow and vice-versa. The S&P is Higher and Crude is trading Lower which is correlated. Gold is trading Higher which is correlated with the US dollar trading Down. I tend to believe that Gold has an inverse relationship with the US Dollar as when the US Dollar is down, Gold tends to rise in value and vice-versa. Think of it as a seesaw, when one is up the other should be down. I point this out to you to make you aware that when we don't have a correlated market, it means something is wrong. As traders you need to be aware of this and proceed with your eyes wide open. Currently Asia is trading Mixed. Currently all of Europe is trading Higher with the exception of the Spanish Ibex exchange.
Possible Challenges to Traders:
-
Personal Income m/m is out at 8:30 AM EST. This is Major.
-
Personal Spending m/m is out at 8:30 AM EST. This is Major.
-
Revised UoM Consumer Sentiment is out at 10 AM EST. This is not Major.
-
Revised UoM Inflation Expectations is out at 10 AM EST. This is not Major.
-
G20 Meetings - All Day. This is Major.
Traders, please note that we've changed the Bond instrument from the 10 year (ZN) to the 2 year (ZT). They work exactly the same.
We've elected to switch gears a bit and show correlation between the 10-year Treasury notes (ZN) and the S&P futures contract. The YM contract is the Dow Jones Industrial Average, and the purpose is to show reverse correlation between the two instruments. Remember it's likened to a seesaw, when up goes up the other should go down and vice versa.
Yesterday the ZT migrated Lower at around 8:30 AM EST after the economic news reported as of that time. If you look at the charts below the ZT gave a signal at around 8:30 AM and started its Downward slide. Look at the charts below and you'll see a pattern for both assets. The Dow moved Higher at 8:30 AM and the ZT moved Lower at around the same time. These charts represent the newest version of BarCharts, and I've changed the timeframe to a 15-minute chart to display better. This represented a Short opportunity on the 2-year note, as a trader you could have netted about 30 plus ticks per contract on this trade. Each tick is worth $7.625. Please note: the front month for ZT is Sept and the Dow is now Sept '24. I've changed the format to filled Candlesticks (not hollow) such that it may be more apparent and visible.
Charts courtesy of Barcharts
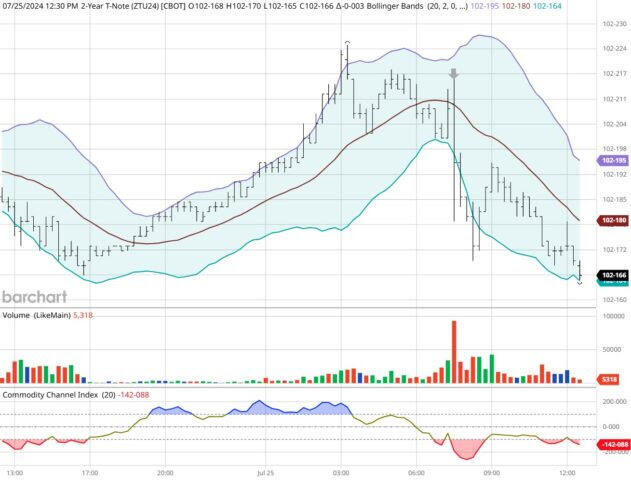
ZT -Sept 2024 - 07/25/24
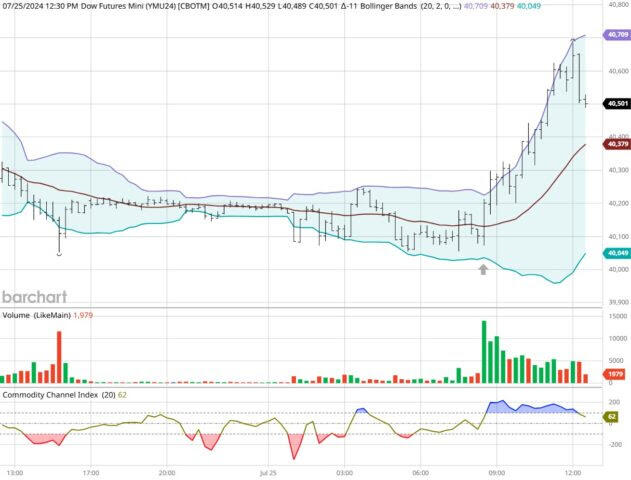
Dow - Sept 2024 - 07/25/24
Bias
Yesterday we gave the markets an Upside bias as we felt that after Wednesday's massive falloff, the markets may want to rebound. Initially it did but at the end of the day finished MIxed with the Dow Higher but the other indices Lower. Today we aren't dealing with a correlated market and our bias is to the Upside.
Could this change? Of Course. Remember anything can happen in a volatile market.
Commentary
Yesterday we gave the markets an Upside bias and initially the markets traded Higher. All indices were Higher until 3:40 PM EST when the S&P and Nasdaq both traded Lower and ended the session in negative territory. Hard to say what caused it to trade Lower as the economic news reported wasn't bad. Advanced GDP came in Higher than expected as did Core Durable Goods Orders. Unemployment Claims came in Lower than expected and that's always good. Today we have Personal Income and Personal Spending and on a lighter note the Paris Summer Olympics starts today and that's always to look forward to. I think it's been about 100 years since Paris last hosted an Olympics.
Author

Nick Mastrandrea
Market Tea Leaves


