![]() Richard Perry
Richard Perry
Independent Analyst
Market Overview
In recent weeks, the market has been tackling the issue of global growth prospects. A drab Eurozone, signs of a pick-up in China and the continued relative outperformance of the US. The focus today is squarely on US growth for Q1. The hype has been built up in recent weeks by a series of positive data surprises (retail sales, trade data) which have boosted expectation. Consensus is looking for another decent quarter at +2.0% annualised (from a downwardly revised +2.2% in Q4 2018). However, the Atlanta Fed’s GDPNow tracker has given a reading of +2.7%, quite a lot more positive and opening the door to a potential surprise in the data. The dollar has been very strong in the run up to this growth number, which begs the question, ow much is baked in? Is a strong number needed to meet fairly heady expectations for the dollar? Major markets are consolidating this morning with little real direction. What is interesting is that there is still a safe haven bias through markets, with the yen and gold performing better whilst bond yields hold their recent declines. The bull run on equities should not necessarily be taken for granted.

Wall Street closed a shade lower with the S&P 500 losing 1 tick at 2926. US futures are similarly cautious in early moves today. Asian markets are cautiously lower with the Nikkei -0.2% on the final day before a 10 day national holiday, whilst Shanghai Composite is -0.3%. In Europe there is a mixed look to the opening moves, with FTSE futures a shade higher +0.1% but DAX futures are lower by -0.1%. In forex, there is little real direction although AUD and NZD are slightly higher. In commodities the near term support for gold continues to build as it tests $1280 again. Oil continues to unwind back after recent gains.
On the economic calendar, a first look at US growth for the first quarter will be of primary focus for traders today. US Q1 Advance GDP is at 1330BST and consensus forecast is +2.0% (+2.2% final Q4 2018). However, with considering the final Atlanta Fed GDPNow had a reading of +2.8% there is a realistic prospect of an upside surprise. The final reading of Michigan Sentiment for April is at 1500BST and is expected to be revised higher to 97.0 (from 96.9 prelim, but down from 98.4 final March).
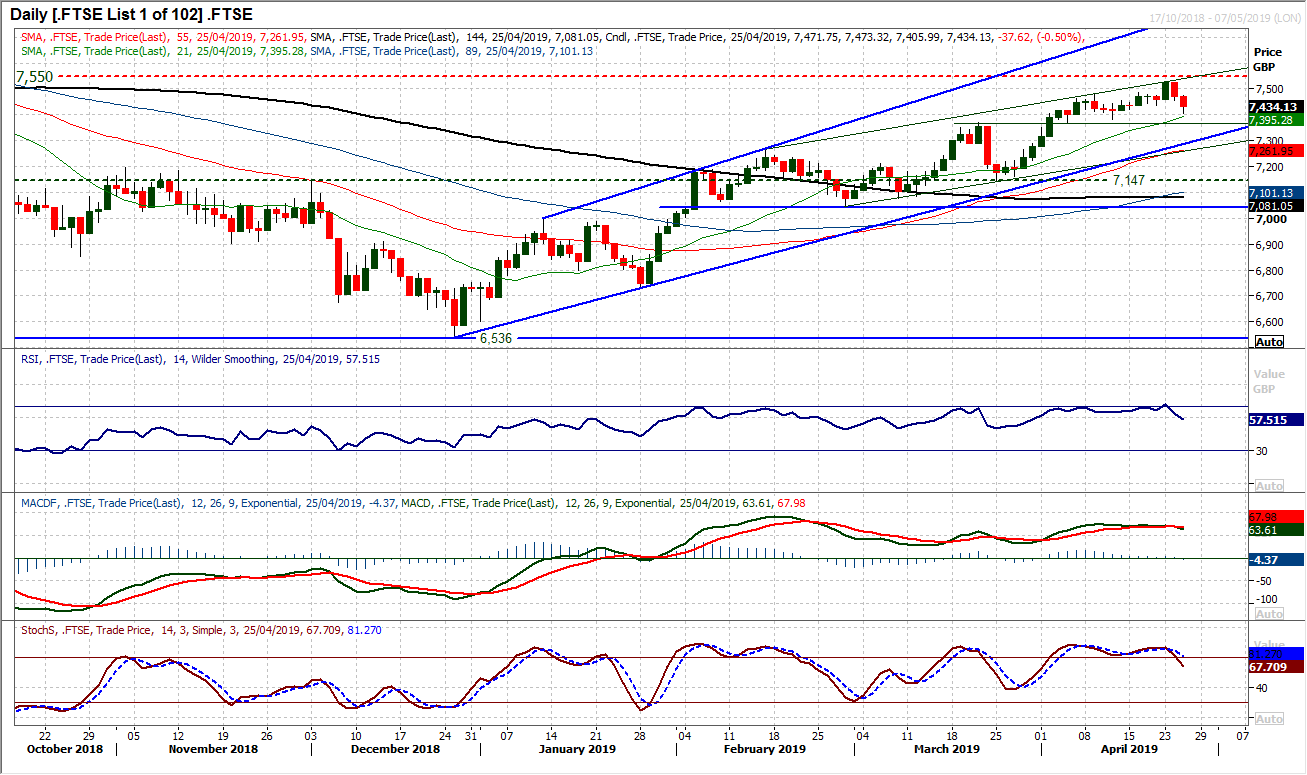
Chart of the Day – FTSE 100
The big bull run higher has stumbled in recent sessions and now threatens a correction. An uptrend channel in place since December has posted a series of higher lows and higher highs, but with two successive decisive negative candles a near term unwinding move is developing now. Momentum indicators have given a series of near term profit taking signals too. The RSI again peaking over 70 to be followed by a move back below 60 is a near term corrective signal. During the past few months each near term correction has pulled back to 50 on RSI. Coupled with bear crosses on MACD and Stochastics, and this suggests that a retreat is on. The pivot of recent weeks at 7370 is the immediate test, but more likely is a pullback towards the channel support. The four month channel is at 7295 today, but there is a slightly shallower two month channel supportive at 7264 today. This also coincides with the rising 55 day moving average (at 7262 today) which has flank the run higher. The medium term outlook remains strong, but near term corrective signals are certainly growing now. On the hourly chart initial resistance is at 7438/7454. Initial support is at 7385 and 7367.
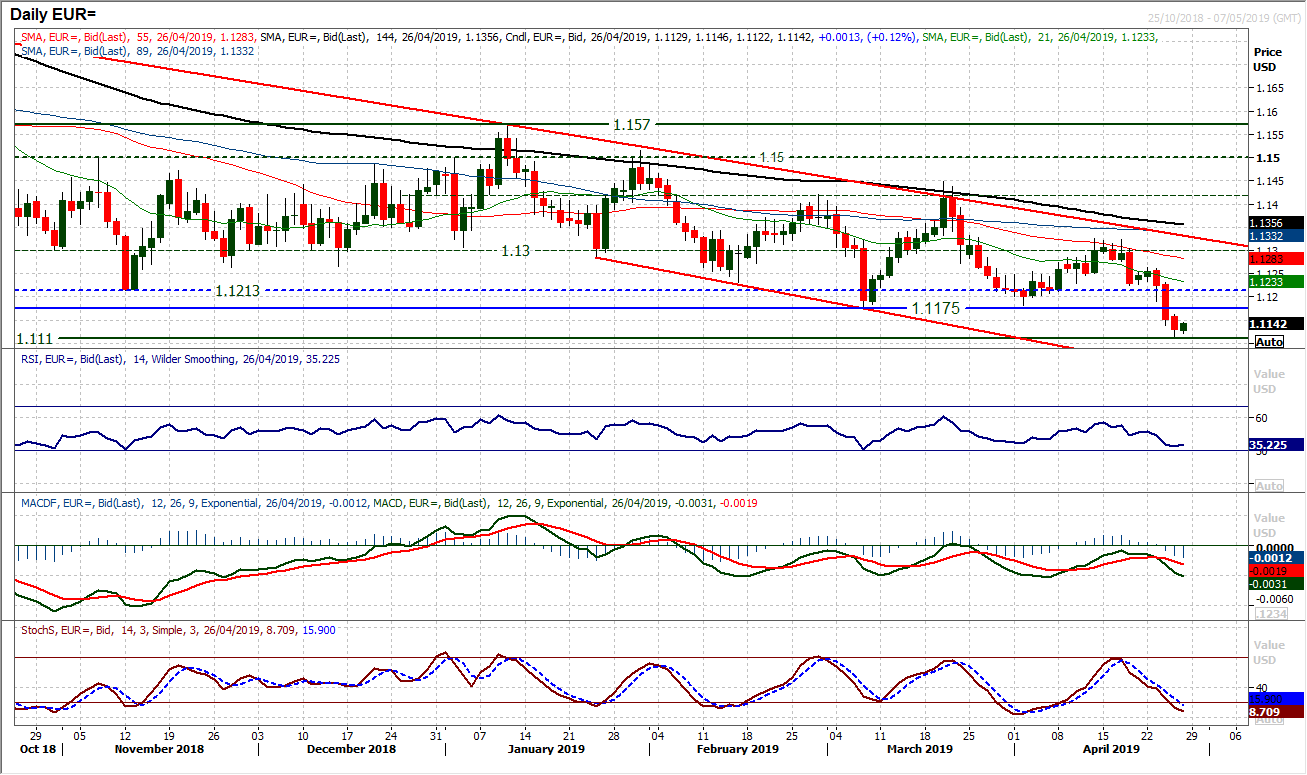
The downside break of $1.1175 is another lower low within this downtrend channel. With momentum indicators in bearish configuration rallies are a chance to sell. The selling phases of this run lower tends to take the RSI back to 30 before technical rallies tend to set in. So, with the RSI in the mid-30s, there is still further downside potential. An initial consolidation above $1.1110 (an old historic low from June 2017) has ticked higher, but given the continued negative outlook on Stochastics and MACD, a move towards $1.1000 could easily be seen now. Look for signals of a recovery taking hold on the hourly chart. The hourly RSI is habitually below 50/60, with hourly MACD stuck below neutral. There is a resistance at $1.1160/$1.1175 now, with overhead supply towards $1.1230.
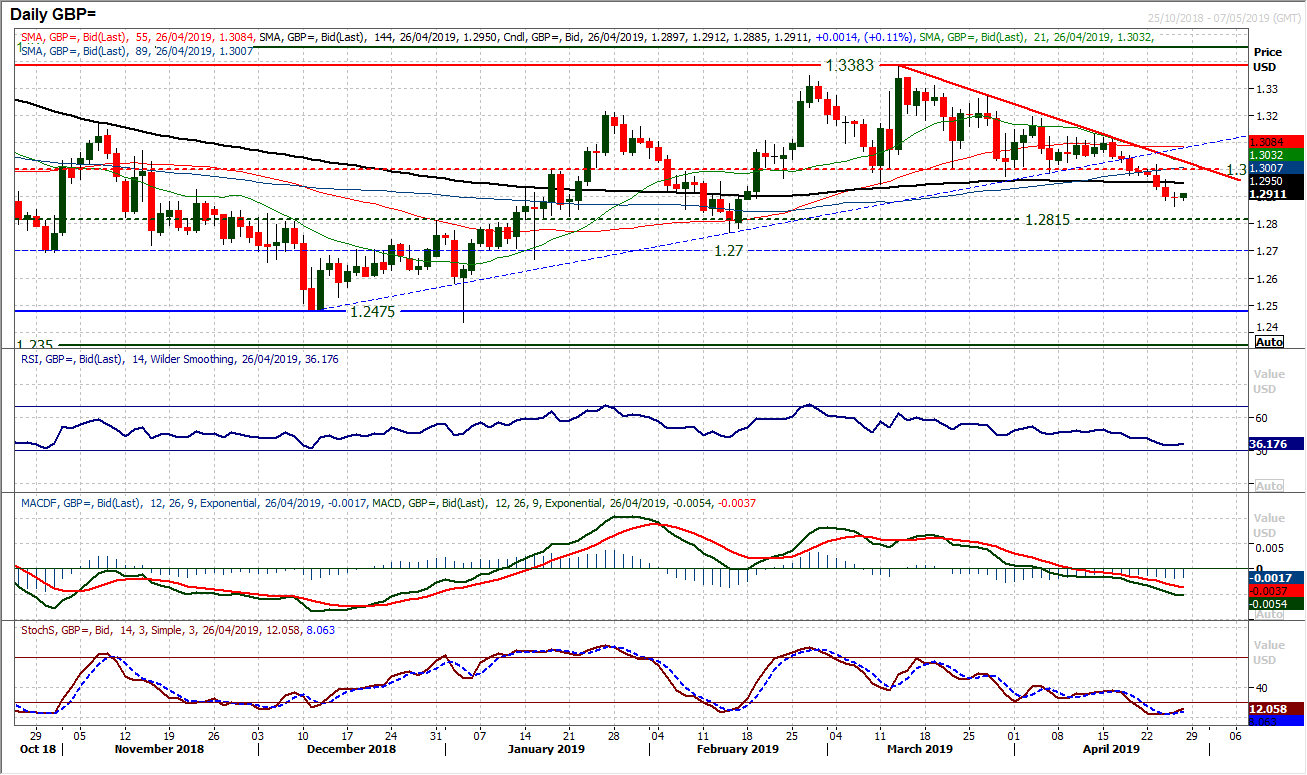
A doji candlestick from yesterday’s session is the first sign of stalling in the correction for almost two weeks. As yet, this is little more than a consolidation, but it does reflect a degree of uncertainty in the immediate downside. Although having broken below $1.3000 opens a retreat towards $1.2700/$1.2800, the prospect of an initial rebound back towards the $1.3000 breakdown should not be ignored. So we need to watch for near term unwinding signals. On the hourly chart, watch for the hourly RSI consistently pushing above 60, and hourly MACD consistently above neutral. Initial resistance is $1.2915 from yesterday’s session, and then $1.2960. The main basis of overhead supply comes in around the old floor at $1.3000. It would need a decisive close above $1.3030 to even entertain the thought of a sustainable sterling recovery. Look to sell intraday rallies for a retest of $1.2865 and then towards the old pivot around $1.2815.
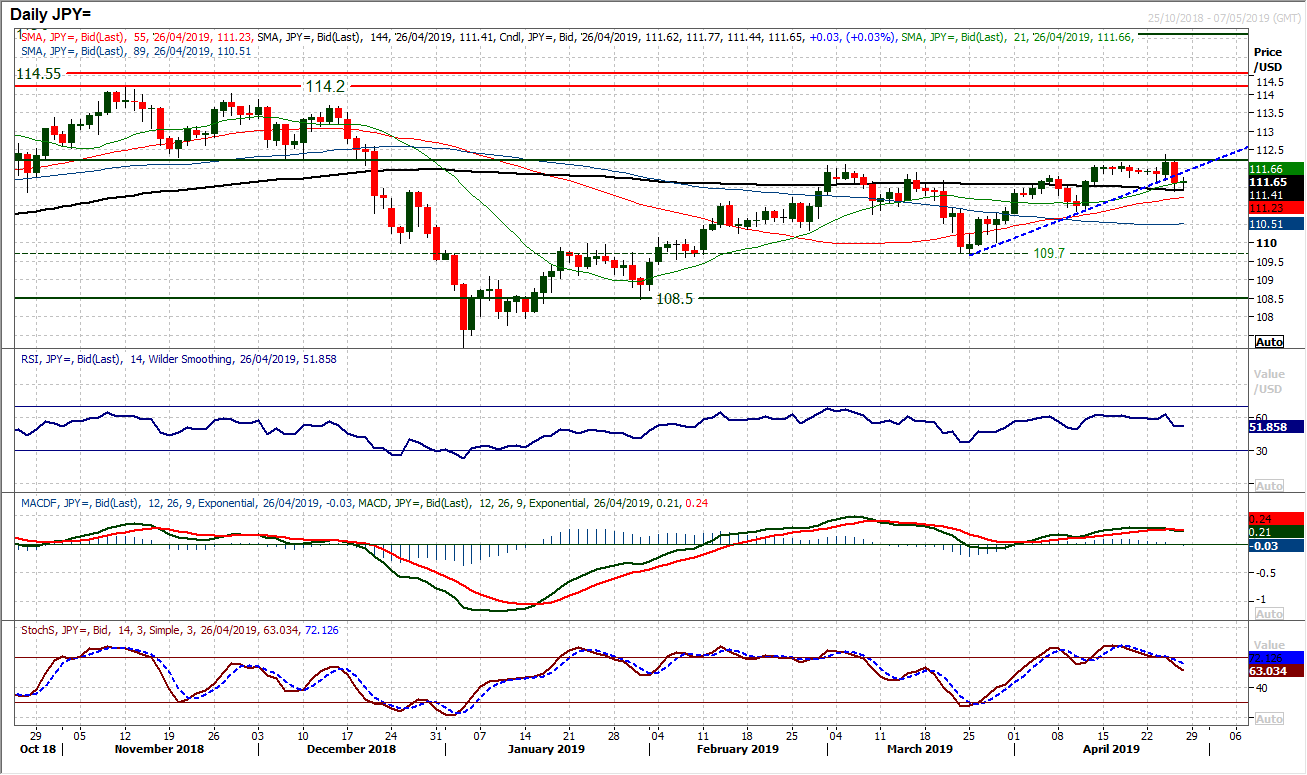
Considering how strong the dollar has been across the majors recently, the performance of the yen has been remarkable. Yesterday’s move which dragged the pair lower to break a four week uptrend puts the dollar bull run on the back burner now. Although we remain positive on Dollar/Yen for the prospect of a decisive move above 112.20, a lack of conviction has dragged on the outlook. The hourly chart is a little messy now, breaking the uptrend and choppy momentum configuration. Breaking 111.60 support will have been disappointing, but above 111.20 the outlook remains positive. Below the higher reaction low at 110.85 and the bulls will have lost control. Still look for a close above 112.20 to break the period of frustration. However, for now the market lacks real direction.
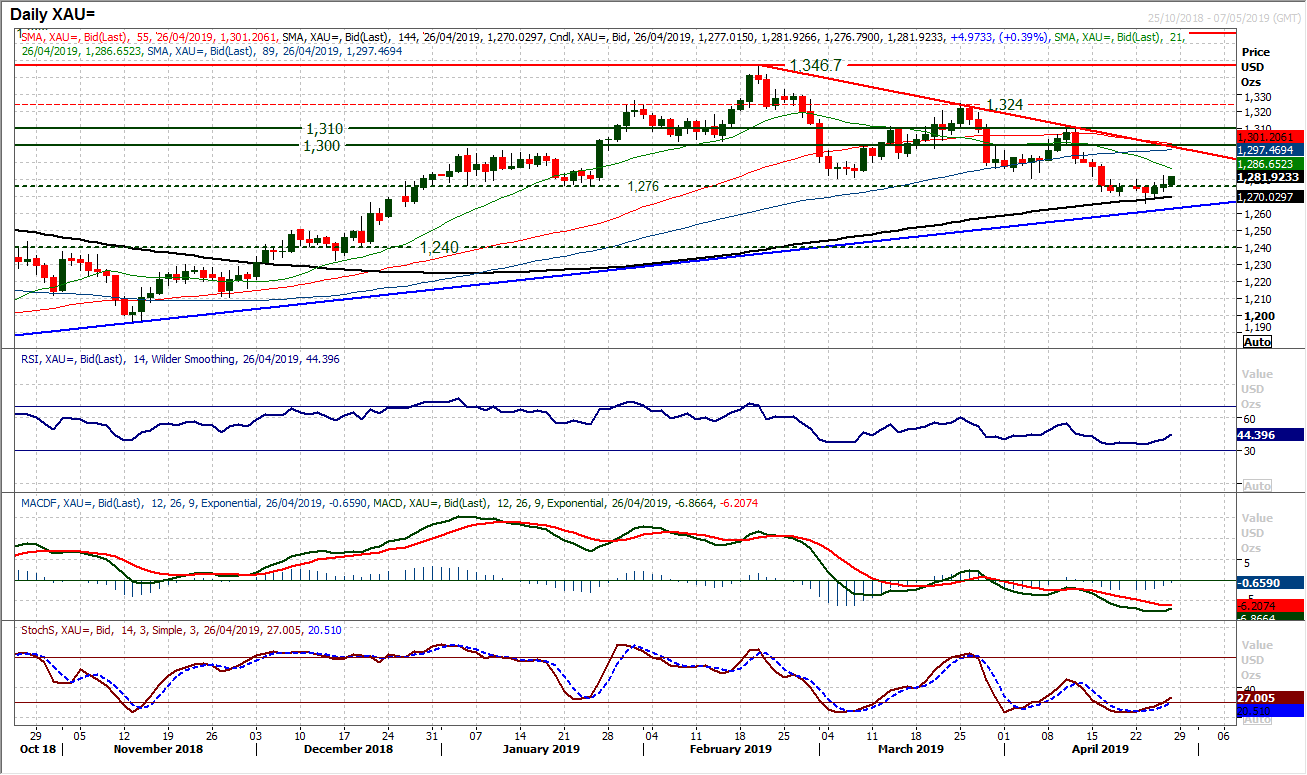
Gold
A near term technical rally is threatening to take hold after two successive positive closes. Having spent the past week stuck under $1280, the close back above $1280 is threatening, a move that would open the prospect of a near term bounce. The move comes with near tem positive signals on RSI (back above 40) and Stochastics (bull cross). However, a nine week downtrend is strong and near term rallies have struggled for traction in recent months. The trend sits at $1299 today which is now under the long term pivot resistance at $1300/$1310. The rally would need to break through $1310 to change the medium term corrective outlook. The hourly chart shows a near term improvement in momentum and initial resistance is a pivot at $1290. There is room for an unwinding rebound, but it is a move counter to the medium term trend now.
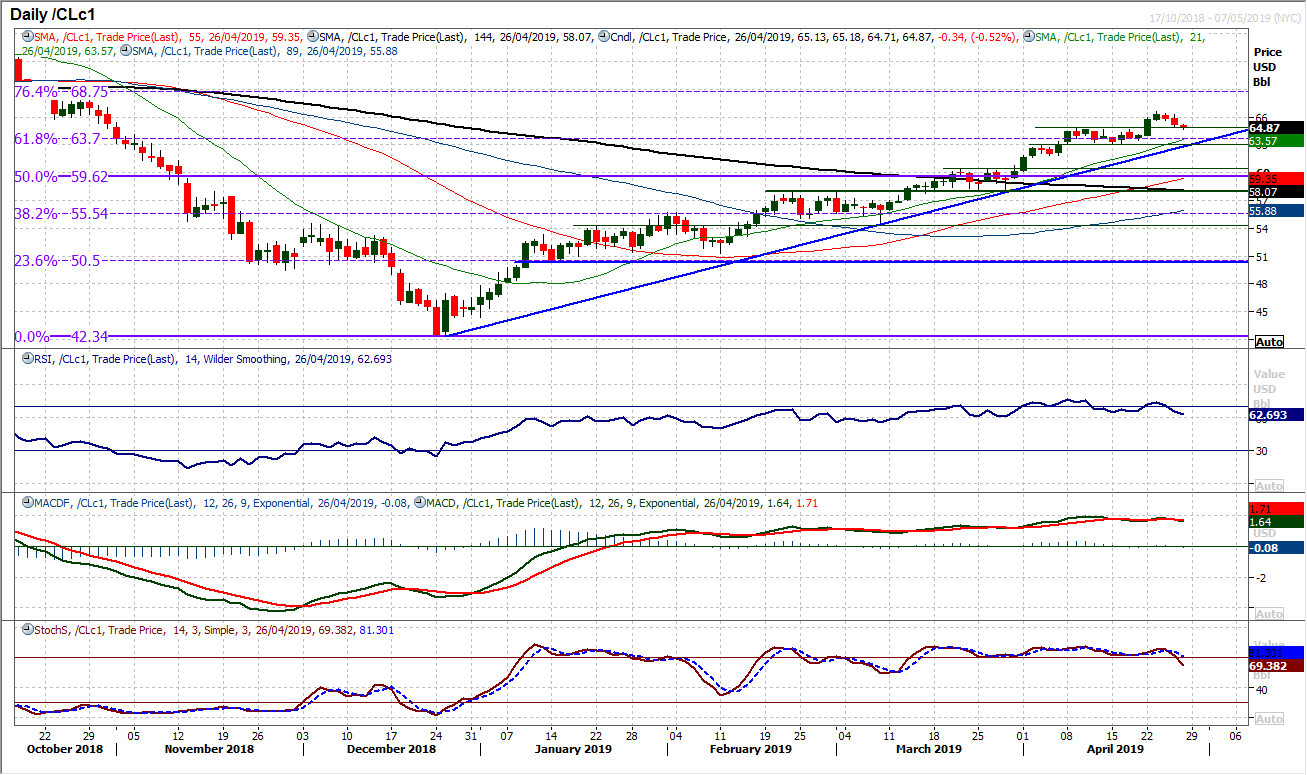
WTI Oil
The breakout above $64.80 hit the buffers earlier in the week and the move has since drifted back. In recent months it is commonplace to see breakouts subsequently consolidate within the uptrend before the next upside break. A couple of sessions pulling back from the $66.60 (incidentally a mini range breakout target) seems to be just that. Momentum indicators are strongly configured but are again unwinding as the market has drifted back into the breakout support at $64.80. Concern for the bull run would grow if the RSI were to drop decisively under 60, but for now this is another opportunity. The previous breakout support at $64.80 is initial support, whilst the $63.00 mid-April low is increasingly important. The rising 21 day moving average (currently $63.55) has been a key basis of support for several months whilst the four month uptrend sits at $62.80. Subsequently, near term corrections are a chance to buy for another breakout above $66.60. This would re-open the way to the 76.4% Fibonacci retracement at $68.75 as the next consolidation point.
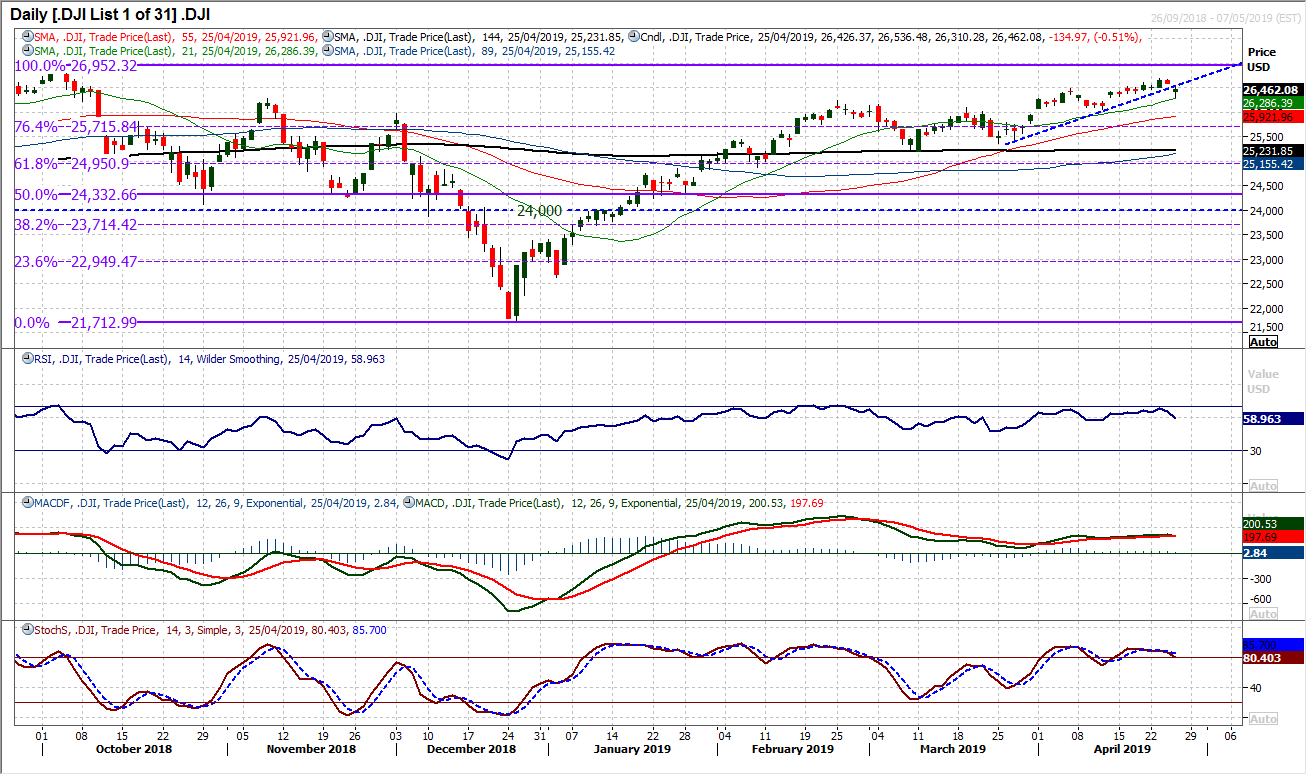
Dow Jones Industrial Average
The bulls are facing a few question marks after the price action of the last two sessions. Falling back from a six month high of 26,695 a couple of negative closes means that a four week uptrend has been broken. For now this is nothing to be overly alarmed by, but it will give some cause for concern. Yesterday’s intraday rebound into the close did form a positive candle (arguably a bull hammer, although not at the bottom of a downtrend), however it will be the reaction in today’s session which will be key. If followed by another negative close then the positive aspects of this candle will be diminished. The momentum indicators needs watching too. The RSI has ticked back below 60 whilst the Stochastics and MACD lines are stalling. Support at 26,310 is important near term as a breach would open a test of the 26,062 higher reaction low. A swing above 26,695 re-opens the all-time high at 26,952.
Note: All information on this page is subject to change. The use of this website constitutes acceptance of our user agreement. Please read our privacy policy and legal disclaimer. Opinions expressed at FXstreet.com are those of the individual authors and do not necessarily represent the opinion of FXstreet.com or its management. Risk Disclosure: Trading foreign exchange on margin carries a high level of risk, and may not be suitable for all investors. The high degree of leverage can work against you as well as for you. Before deciding to invest in foreign exchange you should carefully consider your investment objectives, level of experience, and risk appetite. The possibility exists that you could sustain a loss of some or all of your initial investment and therefore you should not invest money that you cannot afford to lose. You should be aware of all the risks associated with foreign exchange trading, and seek advice from an independent financial advisor if you have any doubts.
Recommended Content
Editors’ Picks
EUR/USD stays in daily range slightly below 1.0900

EUR/USD continues to move up and down in a narrow band slightly below 1.0900 in the second half of the day on Monday. The modest improvement seen in risk mood makes it difficult for the US Dollar to find demand and helps the pair stay in range.
GBP/USD treads water above 1.2900 amid risk recovery

GBP/USD is keeping its range play intact above 1.2900 in the American session on Monday. The positive shift seen in risk sentiment doesn't allow the US Dollar to gather strength and helps the pair hold its ground ahead of this week's key data releases.
Gold extends slide below $2,400

Gold stays under persistent bearish pressure after breaking below the key $2,400 level and trades at its lowest level in over a week below $2,390. In the absence of fundamental drivers, technical developments seem to be causing XAU/USD to stretch lower.
Crypto Today: Bitcoin is less than 10% away from all-time high as Ethereum ETF approval anticipation brews

Bitcoin trades around $68,000 early on Monday, less than 10% away from its all-time high of $73,777 on Binance. Ethereum ETF anticipation brews among traders and Ether investment products see inflow of over $45 million in the past week.
Election volatility and tech earnings take centre stage
/stock-market-graph-gm532464153-55981218_XtraSmall.jpg)
The US Dollar managed to end the week higher as Trump Trades ensued. Safe-havens CHF and JPY were also higher while activity currencies such as NOK and NZD underperformed.