Market correlation in action

USD: Mar '24 is Up at 104.120.
Energies: Mar '24 Crude is Up at 74.59.
Financials: The Mar '24 30 Year T-Bond is Down 20 ticks and trading at 120.07.
Indices: The Mar '24 S&P 500 emini ES contract is 33 ticks Lower and trading at 5007.25.
Gold: The Feb'24 Gold contract is trading Down at 2043.20.
Initial conclusion
This is not a correlated market. The USD is Up and Crude is Up which is not normal, but the 30 Year T-Bond is trading Lower. The Financials should always correlate with the US dollar such that if the dollar is Higher, then the bonds should follow and vice-versa. The S&P is Lower and Crude is trading Higher which is correlated. Gold is trading Lower which is correlated with the US dollar trading Up. I tend to believe that Gold has an inverse relationship with the US Dollar as when the US Dollar is down, Gold tends to rise in value and vice-versa. Think of it as a seesaw, when one is up the other should be down. I point this out to you to make you aware that when we don't have a correlated market, it means something is wrong. As traders you need to be aware of this and proceed with your eyes wide open. Asia is trading Mixed with half the exchanges Lower and the other half Higher. All of Europe is trading Higher.
Possible challenges to traders
-
Unemployment Claims is out at 8:30 AM EST. This is Major.
-
FOMC Member Barkin Speaks at 8:30 AM EST. This is Major.
-
Final Wholesale Inventories m/m is out at 10 AM EST. This is Major.
-
Natural Gas Storage is out at 10:30 AM EST. This is Major.
-
FOMC Member Barkin Speaks at 12:05 PM EST. This is Major.
-
30-y Bond Auction starts at 1 PM EST. This is Major.
-
Mortgage Delinquencies - Tentative. This is Major.
Treasuries
Traders, please note that we've changed the Bond instrument from the 30 year (ZB) to the 10 year (ZN). They work exactly the same.
We've elected to switch gears a bit and show correlation between the 10-year bond (ZN) and the S&P futures contract. The S&P contract is the Standard and Poor's, and the purpose is to show reverse correlation between the two instruments. Remember it's likened to a seesaw, when up goes up the other should go down and vice versa.
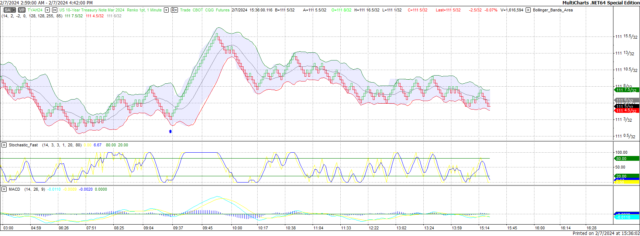
Yesterday the ZN migrated Higher at around 9:30 AM EST as the S&P hit a High at around the same time. If you look at the charts below the S&P gave a signal at around 9:30 AM and the ZN started its Upward trend. Look at the charts below and you'll see a pattern for both assets. S&P hit a High at around 9:30 AM and migrated Lower. These charts represent the newest version of MultiCharts and I've changed the timeframe to a 15-minute chart to display better. This represented a Long opportunity on the 10-year note, as a trader you could have netted about 30 ticks per contract on this trade. Each tick is worth $15.625. Please note: the front month for the ZN is now Mar '24. The S&P contract is now Mar' 24. I've changed the format to filled Candlesticks (not hollow) such that it may be more apparent and visible.
Charts courtesy of MultiCharts built on an AMP platform
ZN - Mar 2024 - 02/07/24
-638429936089909639.png)
S&P - Mar 2024 - 02/07/24
Bias
Yesterday we gave the markets an Upside bias as both the USD and the Bonds were trading Lower Wednesday morning and tis usually reflects an Upside Day. The markets didn't disappoint as the Dow gained 156 points on the day and the other indices closed Higher as well. Today we aren't dealing with a correlated market and our bias is to the Downside.
Could this change? Of Course. Remember anything can happen in a volatile market.
Commentary
Yesterday when we first viewed the markets, we saw the strong possibility of an Upside Day as both the USD and the Bonds were trading Lower and that usually reflects a higher market. Another reason was the Trade Balance number released at 8:30 AM Wednesday morning. The number released was negative which means the US economy imported more goods than it exported. There is nothing new about this as it's been going on for years. However, the number reported (62.2 billion) was dramatically close to the expectation number of 62.0 billion. Immediately after the markets opened the 10-year Treasury Note took off and at the same time the S&P fell. Not off a cliff mind you but it fell, nonetheless. This is Market Correlation in action.
Author

Nick Mastrandrea
Market Tea Leaves


