Majors technical outlook

EUR/USD
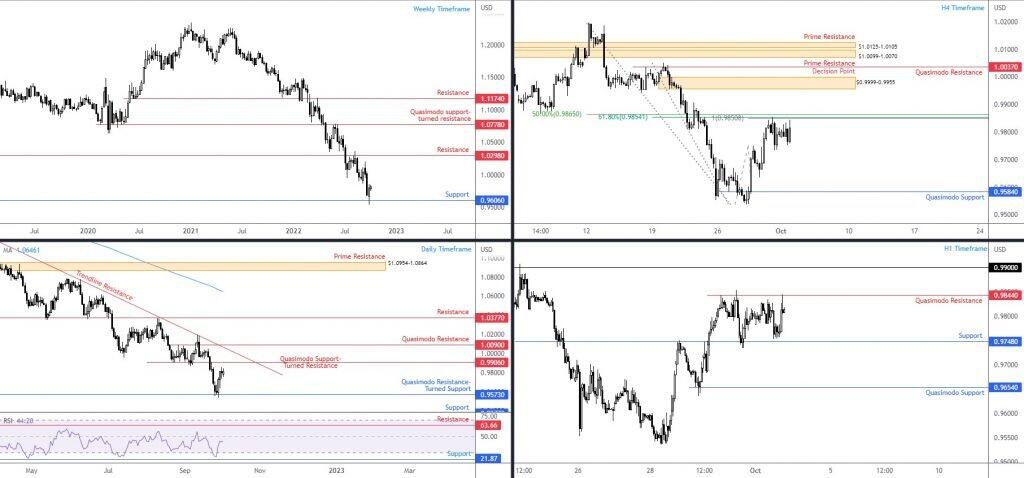
Europe’s common currency welcomed a modest bid against a softer US dollar on Monday. Following the open of US equity cash markets, US ISM Manufacturing recorded a lower-than-expected print (50.9 vs. consensus: 52.5) and consequently weighed on dollar demand, sending the US Dollar Index (DXY) to a low of 111.47.
The technical landscape, in particular, the weekly timeframe, continues to reflect a bearish tone for EUR/USD. Shaped by way of a series of lower lows and lower highs, a primary bear trend has graced the chart since early 2021. You will also note that the monthly timeframe shows the currency pair has been bearish since mid-2008. Although price is attempting to rebound from weekly support at $0.6906, the trend is likely to weigh on upside efforts. A similar view is visible on the daily chart after recovering from a Quasimodo resistance-turned support from $0.9573. Overhead, daily Quasimodo support-turned resistance calls for attention at $0.9906, a base complemented by trendline resistance, taken from the high $1.1495.
Across the page, buyers and sellers are squaring off at the underside of H4 Fibonacci resistance at around $0.9854: a 61.8% Fibonacci retracement (the 50.0% retracement is not a Fibonacci ratio and neither is the 100% projection [this is generally used to denote an AB=CD formation]). Given the lack of selling, rupturing the noted resistances would shine light on a H4 decision point from $0.9999-0.9955, closely sheltered by a Quasimodo resistance at $1.0037. Out of the H1 timeframe, however, an early range is seen forming between Quasimodo resistance at $0.9844 and support from $0.9748. Upstream, $0.99 is in view, housed under the H4 timeframe’s decision point at $0.9999-0.9955.
Technical expectation:
Medium term, buyers appear to have the upper hand: scope to navigate north on the weekly and daily charts until the daily Quasimodo support-turned resistance at $0.9906. This suggests a break of H1 Quasimodo resistance at $0.9844 and the 61.8% H4 Fibonacci retracement ($0.9854) to target at least $0.99, which merges with the current daily resistance level ($0.9906).
AUD/USD
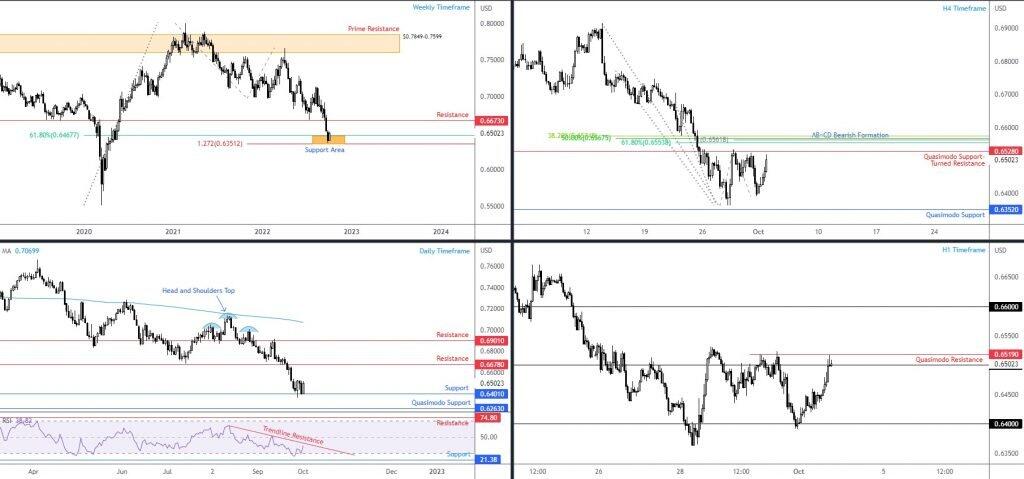
Working with a support area on the weekly timeframe—made up of a 1.272% Fibonacci projection from $0.6351 and a 61.8% Fibonacci retracement at $0.6468—the AUD/USD staged an impressive rebound on Monday and trimmed a portion of last month’s 6.5 per cent decline. Resistance warrants consideration at $0.6673. Aligning with weekly support is a daily support barrier at $0.6401, aided by the (daily) relative strength index (RSI) exiting oversold territory (eyeing trendline resistance, drawn from the high 64.39). Daily resistance is seen at $0.6678 (nearby weekly resistance at $0.6673), whereas a bearish offensive throws light on daily Quasimodo support from $0.6263.
From the H4 timeframe, Quasimodo support-turned resistance at $0.6528 is a clear base of interest, sharing chart area closely with an AB=CD bearish pattern (100% projection at $0.6562) alongside a number of Fibonacci ratios between $0.6575 and $0.6554 (note that the 50.0% retracement is not a Fibonacci value). To the downside, support falls in at $0.6352: Quasimodo formation. In terms of the H1 chart, price recently reclaimed position north of $0.65 and is close to connecting with $0.6519. Above, $0.66 is an upside target, while a rejection under $0.65 directs price back to $0.64.
Technical expectation:
Weekly and daily timeframes, although the currency pair is entrenched within a clear-cut downtrend, are rebounding from support. This may be enough to draw bullish curiosity beyond $0.65 and H4 Quasimodo support-turned resistance at $0.6528 to test the H4 AB=CD bearish formation at $0.6562. In light of the bigger picture’s direction (south), the H4 AB=CD level (and neighbouring H4 Fibonacci ratios) could see sellers respond from this area.
USD/JPY
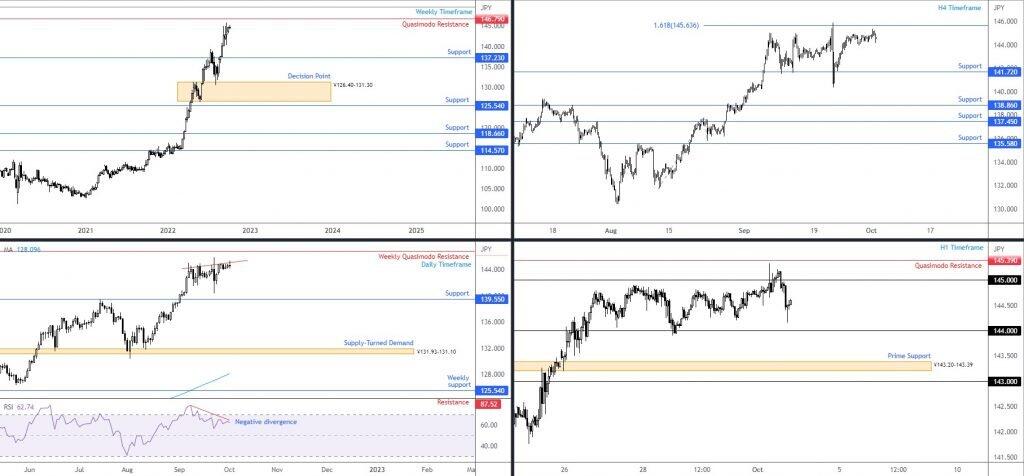
It was a somewhat quiet session for the USD/JPY on Monday, settling mostly unmoved off session pinnacles at ¥145.33.
The weekly timeframe’s price action continues to cement position north of support at ¥137.23, inching towards forging a fresh 24-year high with scope to climb to weekly Quasimodo resistance at ¥146.79 (in line with the current primary bull trend). Note that directly above the aforementioned resistance resides a weekly 100% projection at ¥149.66 (an AB=CD bearish pattern). In terms of supportive structure, daily support falls in at ¥139.55, closely followed by weekly support at ¥137.23.
Interestingly, the daily timeframe’s relative strength index (RSI) ventured outside of its overbought territory (70.00) and is establishing what I see as early bearish divergence (negative divergence). This informs market participants that upside momentum is slowing and that a test of weekly Quasimodo resistance could trigger a bearish scenario.
As evident from the H4 timeframe, resistance is featured in the form of a 1.618% Fibonacci projection at ¥145.64, and support demands attention from ¥141.72. A closer reading of price action on the H1 timeframe reveals the unit failed to command a presence above ¥145, consequently dropping to a low ahead of ¥144 and leaving Quasimodo resistance at ¥145.39 unchallenged. South of ¥144 sheds light on prime support coming in from ¥143.20-143.39 which is stationed above ¥143.
Technical expectation:
Weekly Quasimodo resistance at ¥146.79 is a level that traders are likely to have on their watchlists in light of the slowdown in momentum. However, before reaching this far north, a drop under ¥144 on the H1 to test H1 prime support at ¥143.20-143.39 could be on the table to draw in fresh buyers. This is due to the lack of obvious support seen between current price and the aforementioned prime support.
GBP/USD
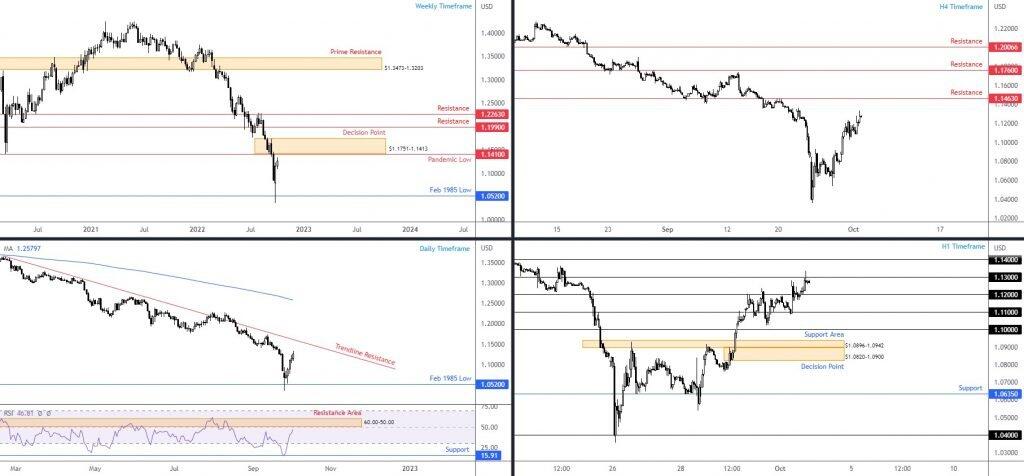
Dollar softness amid weaker-than-expected ISM Manufacturing data, as well as the UK chancellor Kwasi Kwarteng confirming that the UK government are scrapping plans to cut the highest rate of income tax, underpinned sterling against its US counterpart on Monday.
GBP/USD, adding 1.5 per cent and recording a fifth consecutive daily gain, elevated the currency pair to within a stone’s throw of weekly resistance at $1.1410 and a neighbouring weekly decision point at $1.1751-1.1413. Combined, these technical levels are an important juncture, which happens to join hands with a daily trendline resistance, extended from the high $1.3639. The daily timeframe also shows the relative strength index (RSI) on the doorstep of 50.00 and a resistance area forged from 60.00 and 50.00 (common in downtrends).
Longer-term trend direction has also faced southbound since February 2021, and daily price has remained under its 200-day simple moving average ($1.2580) since August 2021.
The H4 timeframe offers little at the moment, aside from resistance marked at $1.1463. Lower on the curve, shorter-term flow on the H1 timeframe has price kissing the lower side of $1.13 after spiking to a high of $1.1334 (and shaping a shooting star candlestick pattern [bearish signal]). Below, I see support at $1.12 while above $1.13 is $1.14.
Technical expectation:
The pandemic low of $1.1410 remains in the line of fire for sellers on the bigger picture, aided by the weekly decision point at $1.1751-1.1413 and daily RSI resistance between 60.00 and 50.00. In view of this, a break of $1.13 could form, taking price to $1.14 at which point sellers may begin to show interest having noted the connection it has with weekly resistances (see above).
Author

Aaron Hill
FP Markets
After completing his Bachelor’s degree in English and Creative Writing in the UK, and subsequently spending a handful of years teaching English as a foreign language teacher around Asia, Aaron was introduced to financial trading,


