Looking for tell-tale signs

If you look across price charts enough, you can start to see little tell-tale signs about what’s happening.
This is particularly so in forex, where the major pairs are linked by moves in the US dollar. But it’s also true in other markets like stocks, because many trade as part of an index.
You may recall that last week (week 7) we were talking about whether to ‘fade or not to trade’ the rebound in EUR/USD because the weekly trend is still downwards. Well as it happens EUR/USD did close lower last week but that could easily be temporary weakness before the rebound continues.
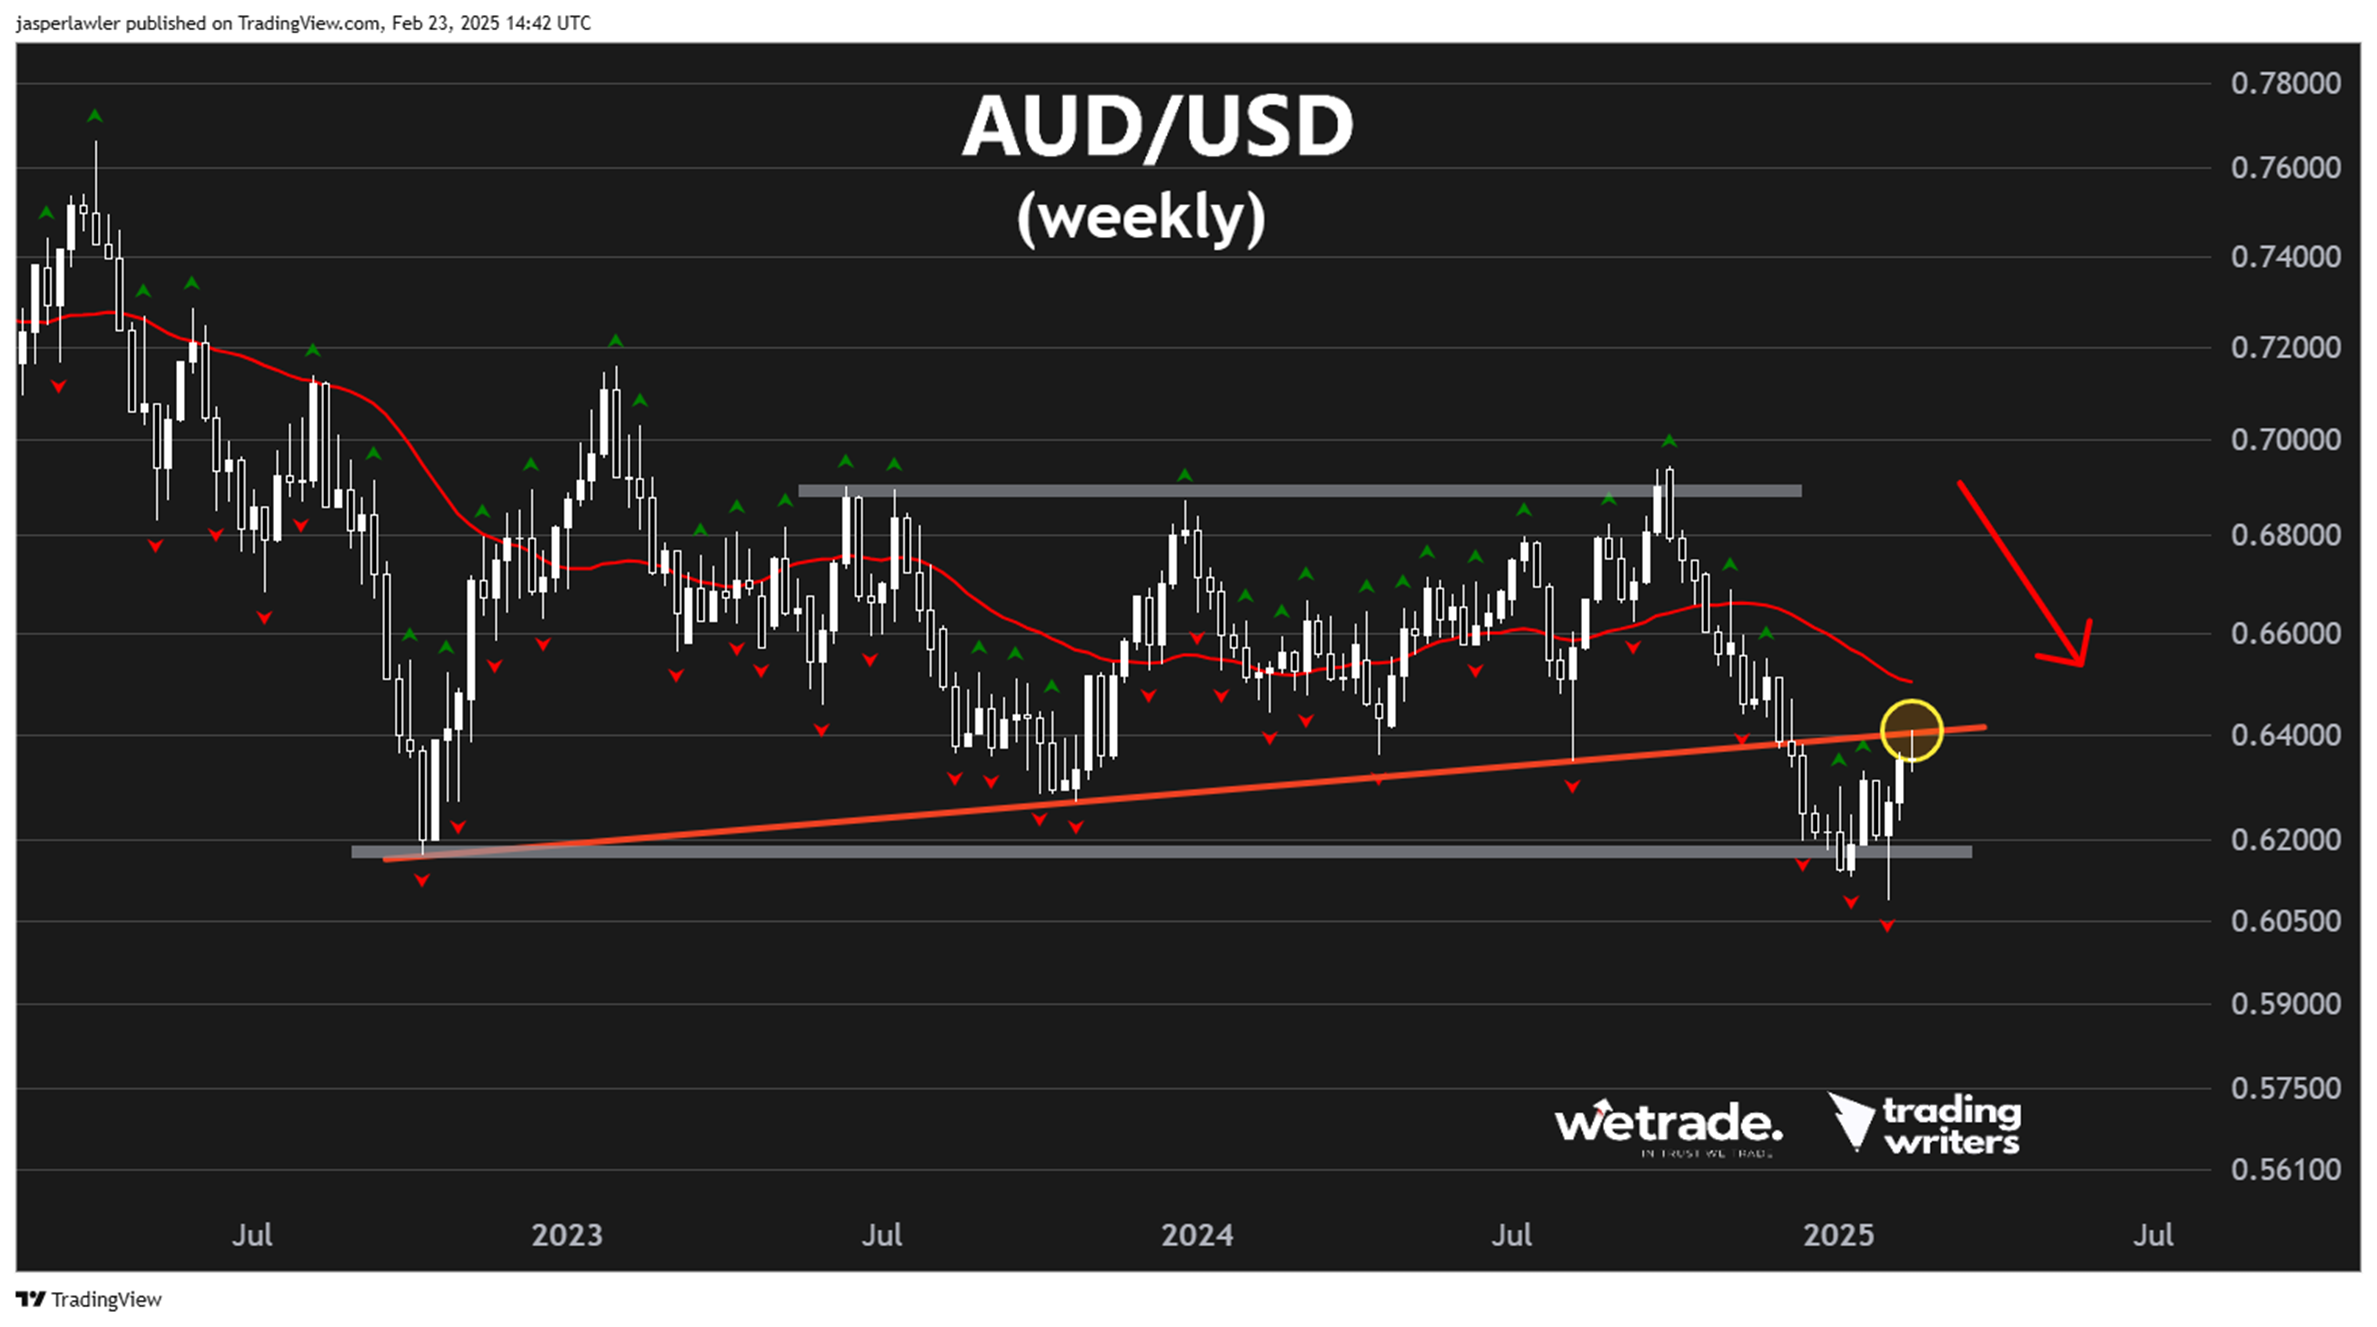
AUD/USD
The Aussie dollar pair ended flat last week, but what caught our eye was the pullback away from the long term broken uptrend line, which we last alluded to back in week 53 2024. We have circled this in yellow.
This is a tell-tale sign that sellers are re-entering the market.
Since buyers are still in control for now, there’s a good chance last week’s high gets breached. And if the price keeps marching higher, we will not stand in its way.
However, if the price reverses and holds under 0.64. We will be looking to enter the market on the short side.
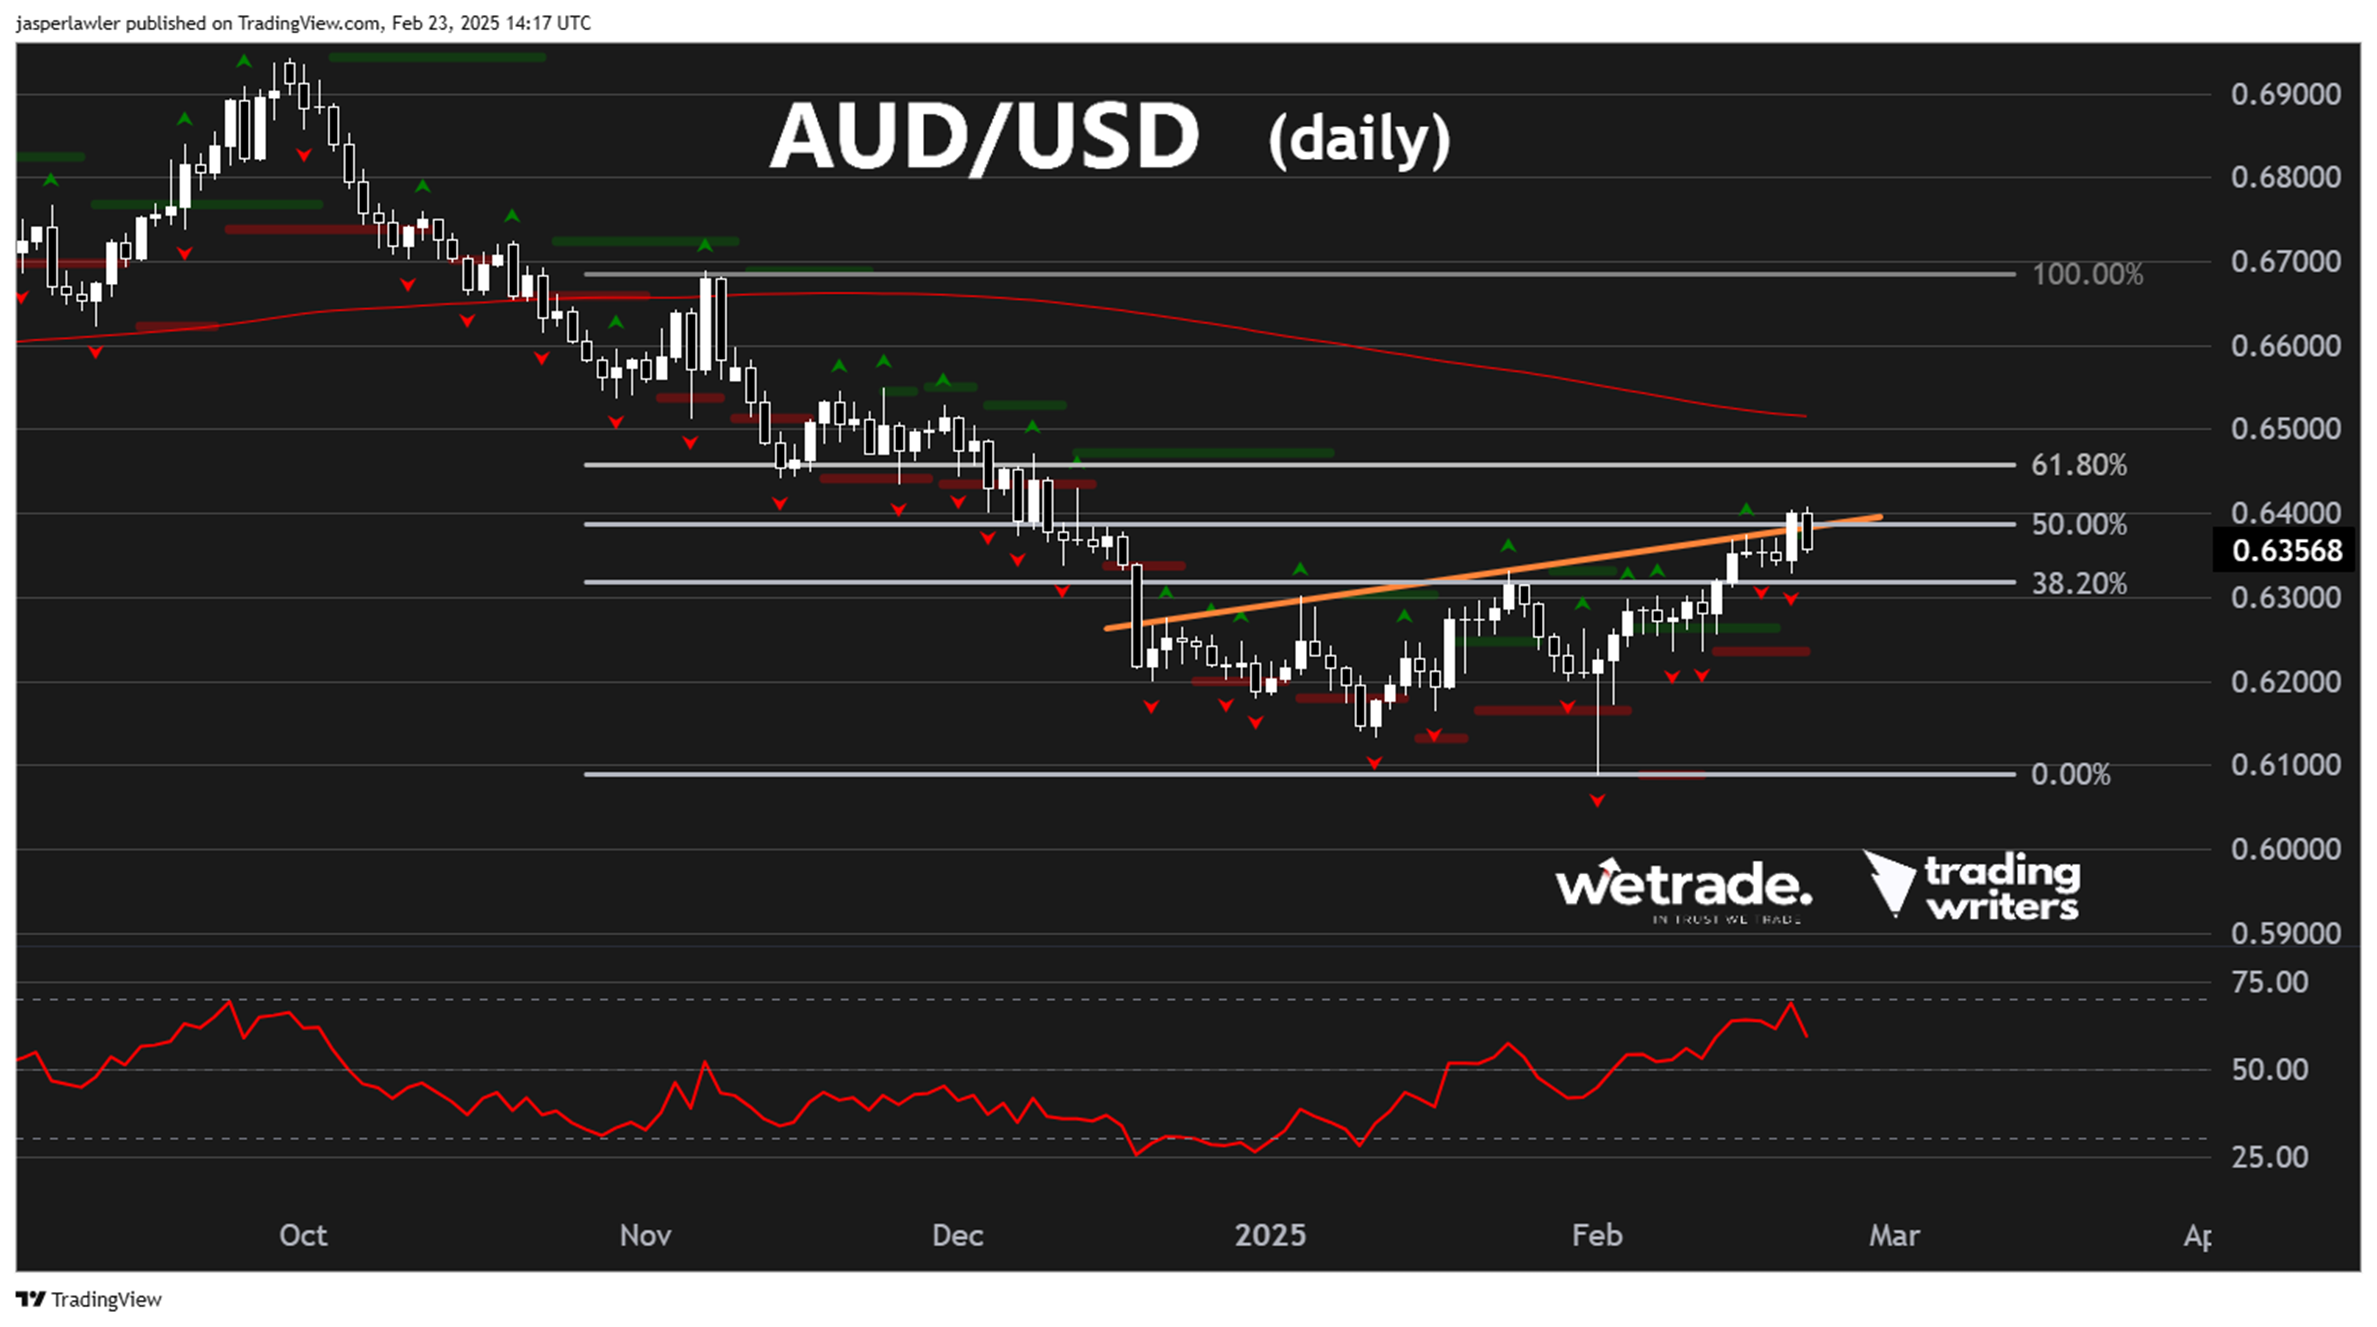
On the daily chart, you can see here that we are looking to enter the market short as
- Price enters the golden pocket between the 50 and 61.8% Fibonacci retracement levels.
- The RSI is overbought at the 70 level
- While the price trades under the 30-week moving average
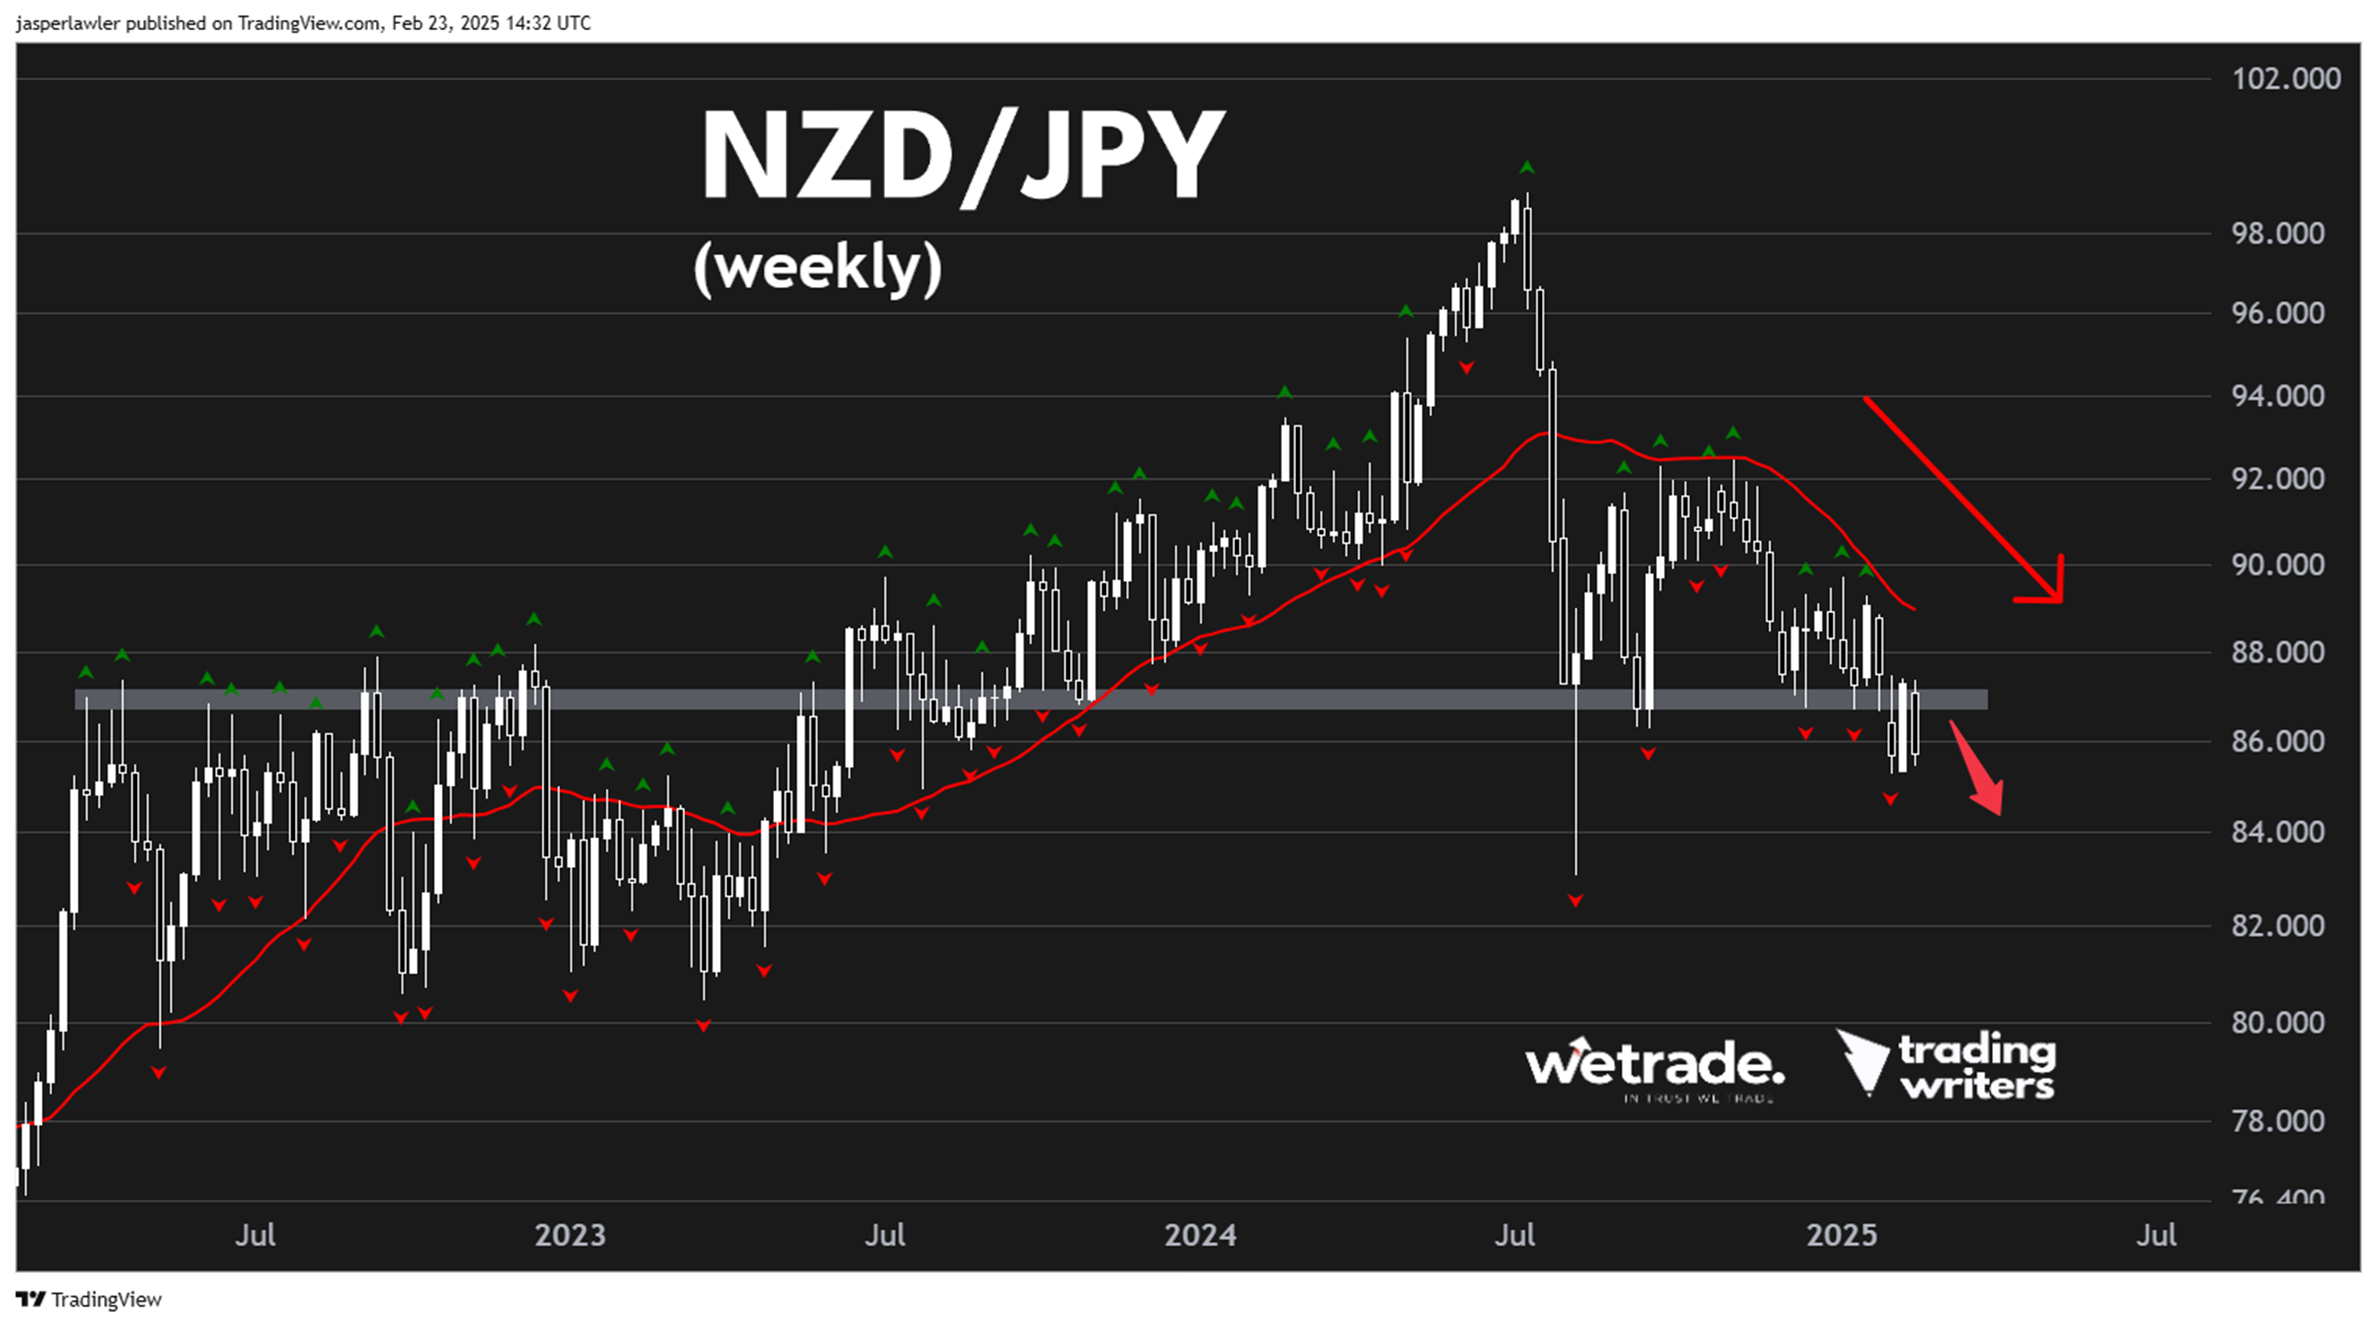
NZD/JPY
Sticking with the Australiasian pairs for now, we are turning back to NZD/JPY, which we recently covered for the first time in week 5.
In essence I highlighted 87.0 as the key level in NZD/JPY - and it has been.
Having broken the support, the price has rebounded back to it and then turned lower again, marking a successful re-test.
This is a classic short setup.
As always, the price does what it wants to do- and this short setup could fail. But it is a setup nonetheless.
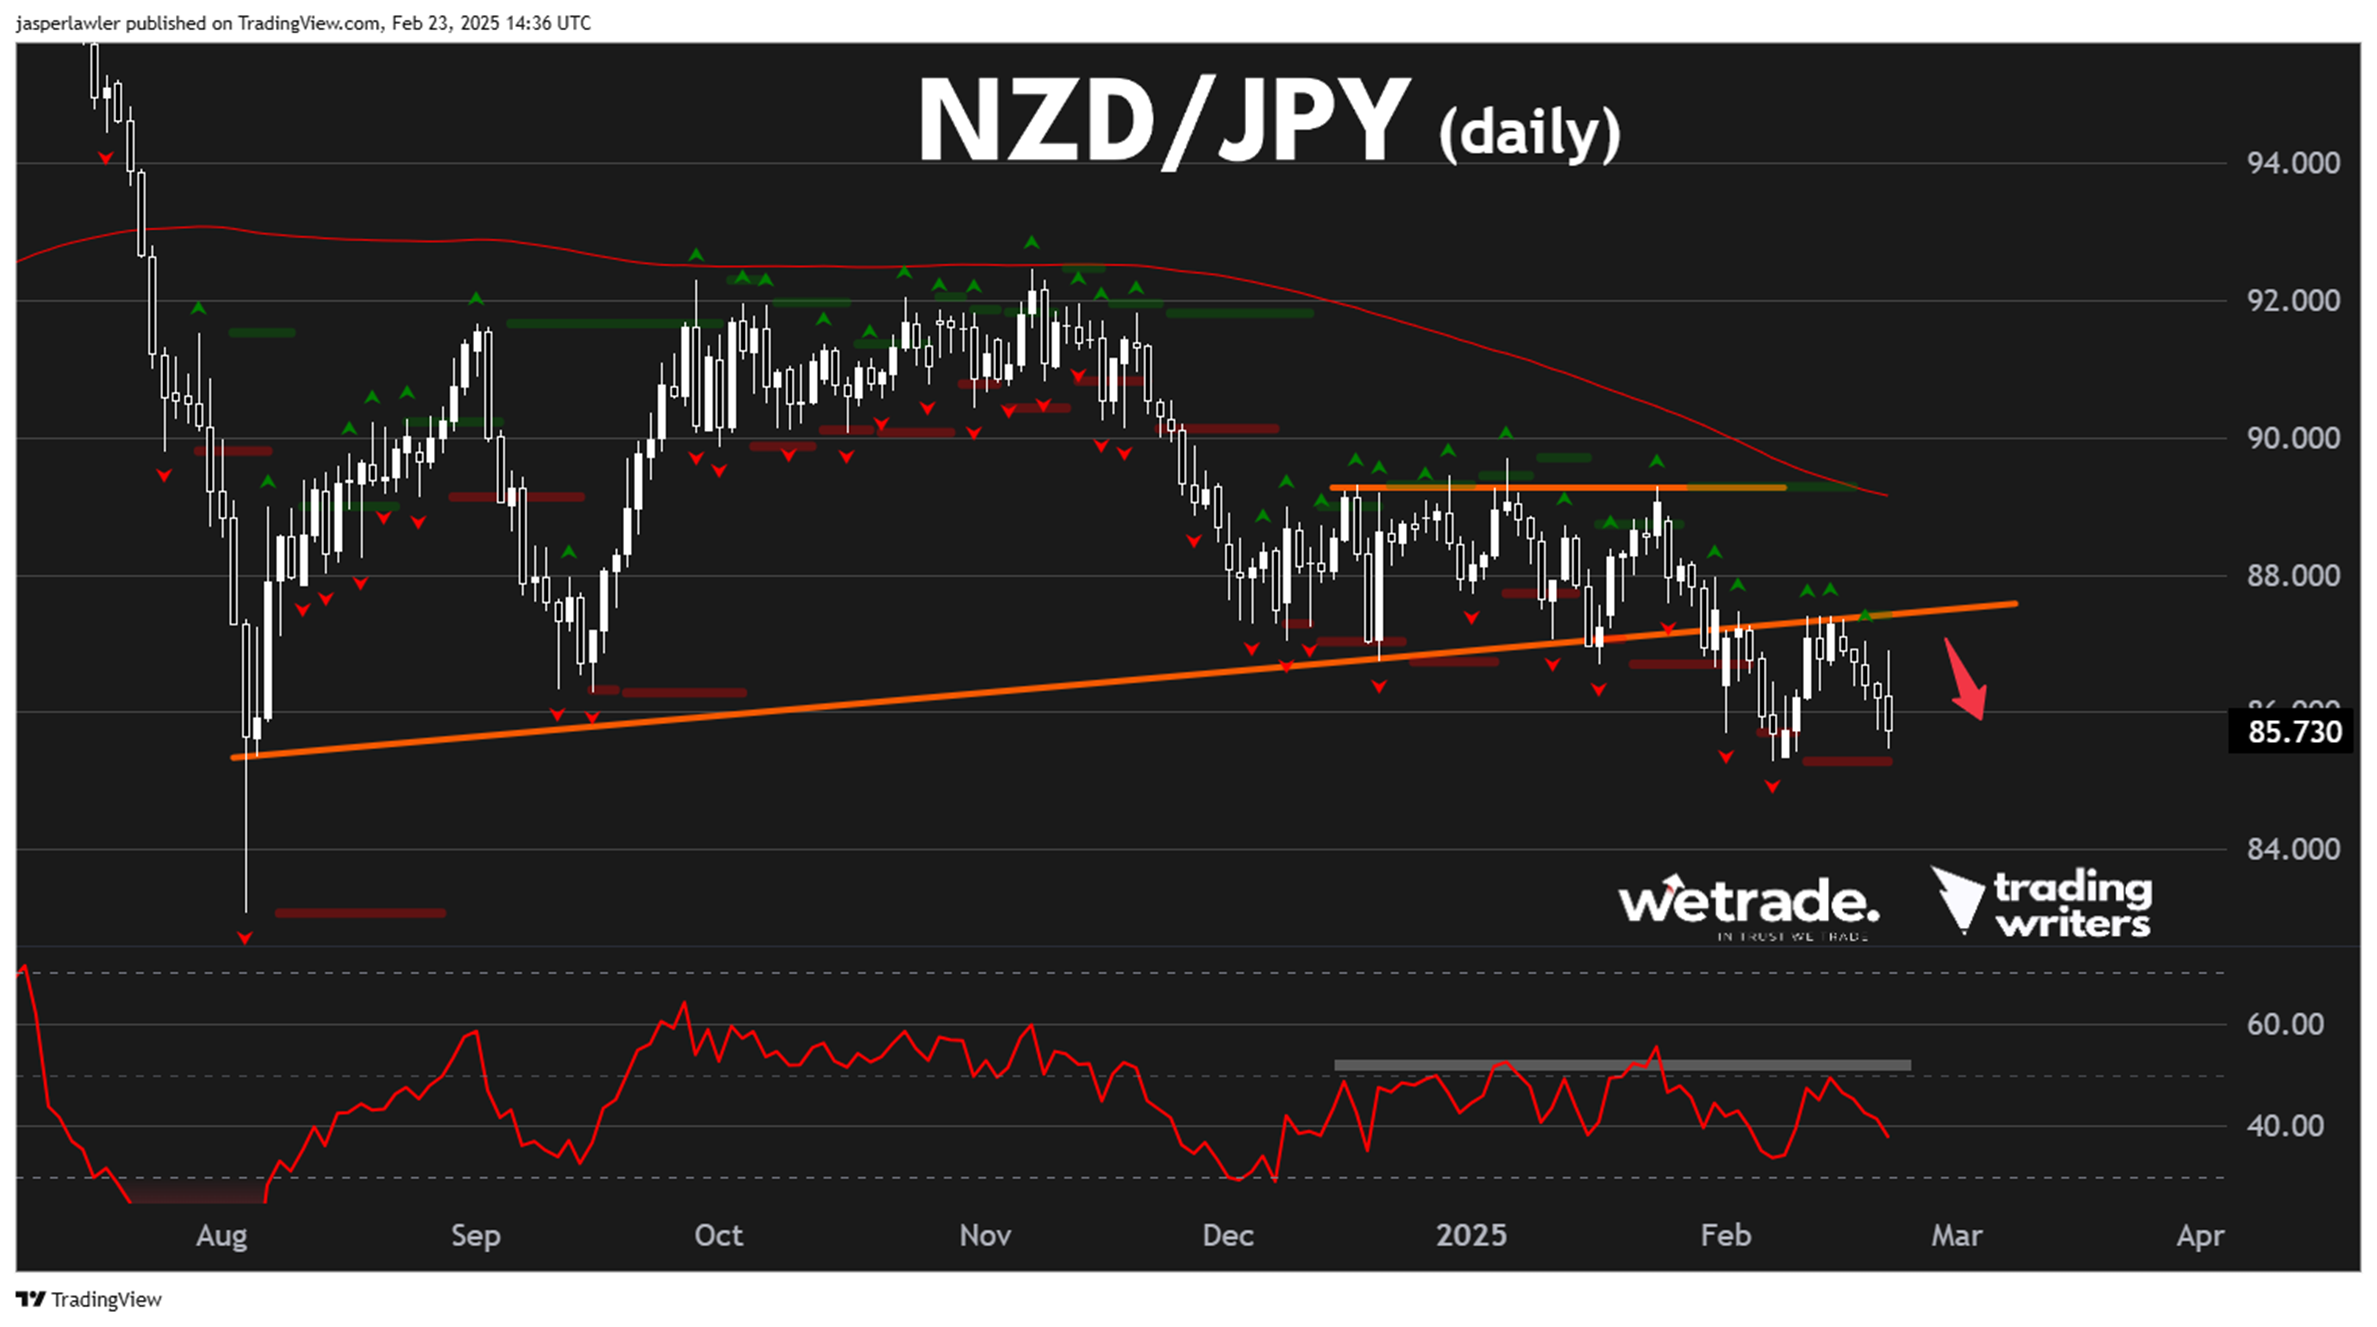
Looking at the daily chart you can see the broken rising trendline has been re-tested twice without a successful breach. You can see similar action at the 50 level on the RSI.
Given the long term downtrend in this pair with the price under the 30 week moving average - I favour a continuation move lower after the breakdown with the August 2024 low around 83 as the next major target.
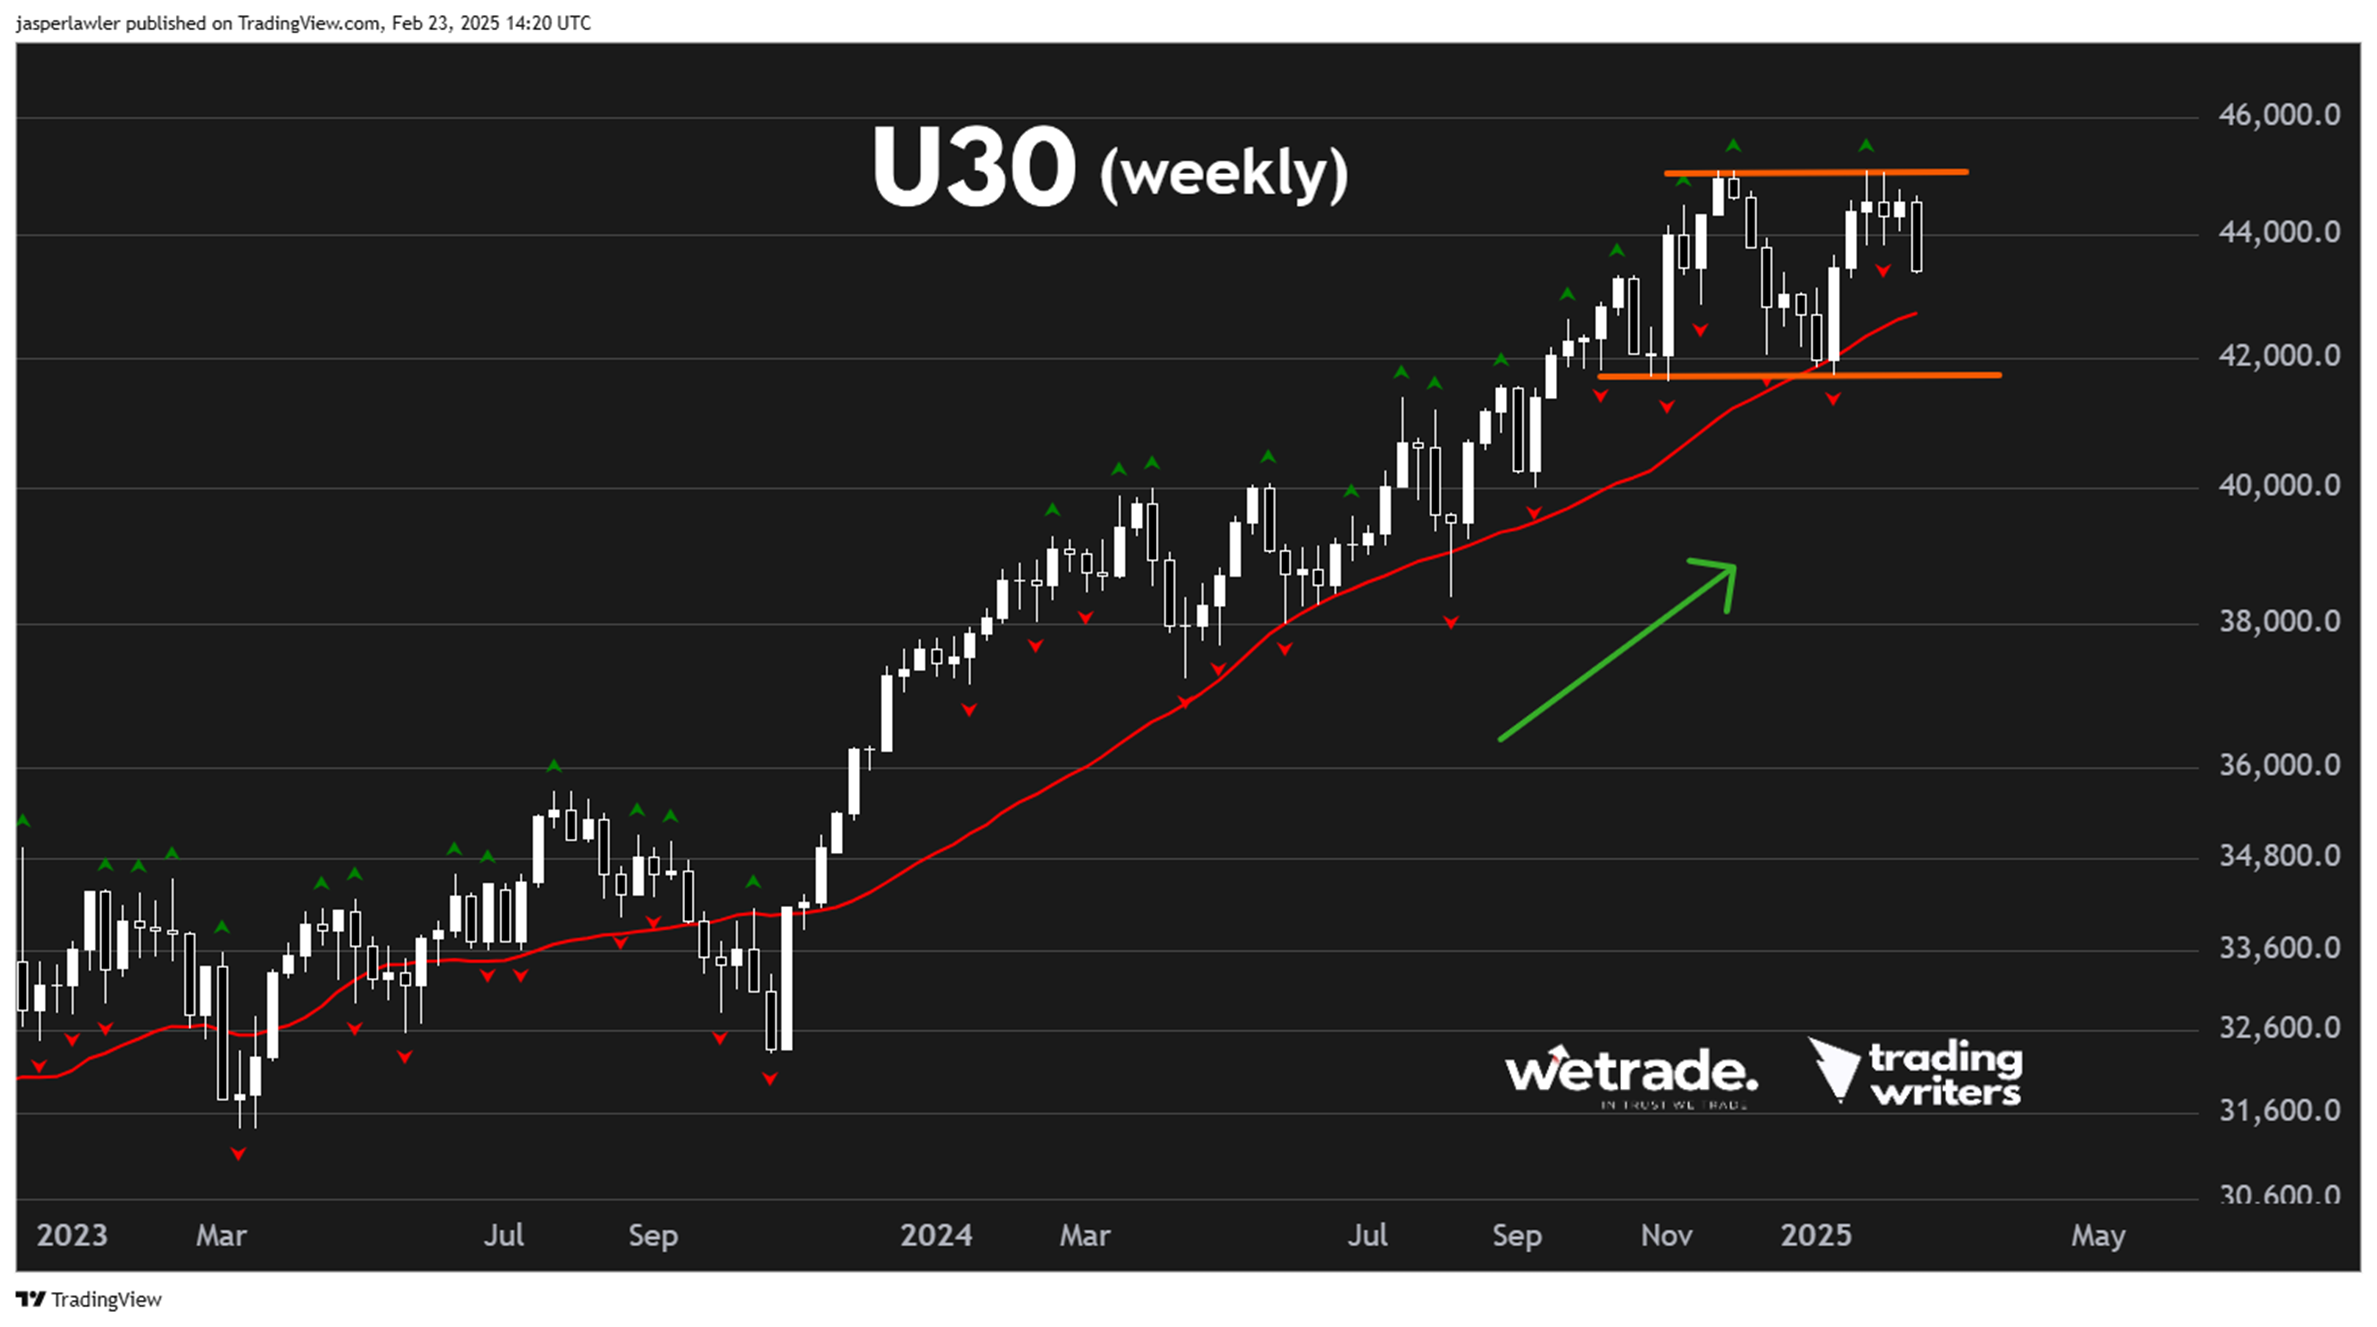
US30 (U30/USD)
I wanted to include this chart because it caught a lot of attention last week - even more than usual.
U30/USD - as traded on WeTrade’s trading platforms - has formed a double top pattern. For the pattern to complete, the price would need to break below 42000.
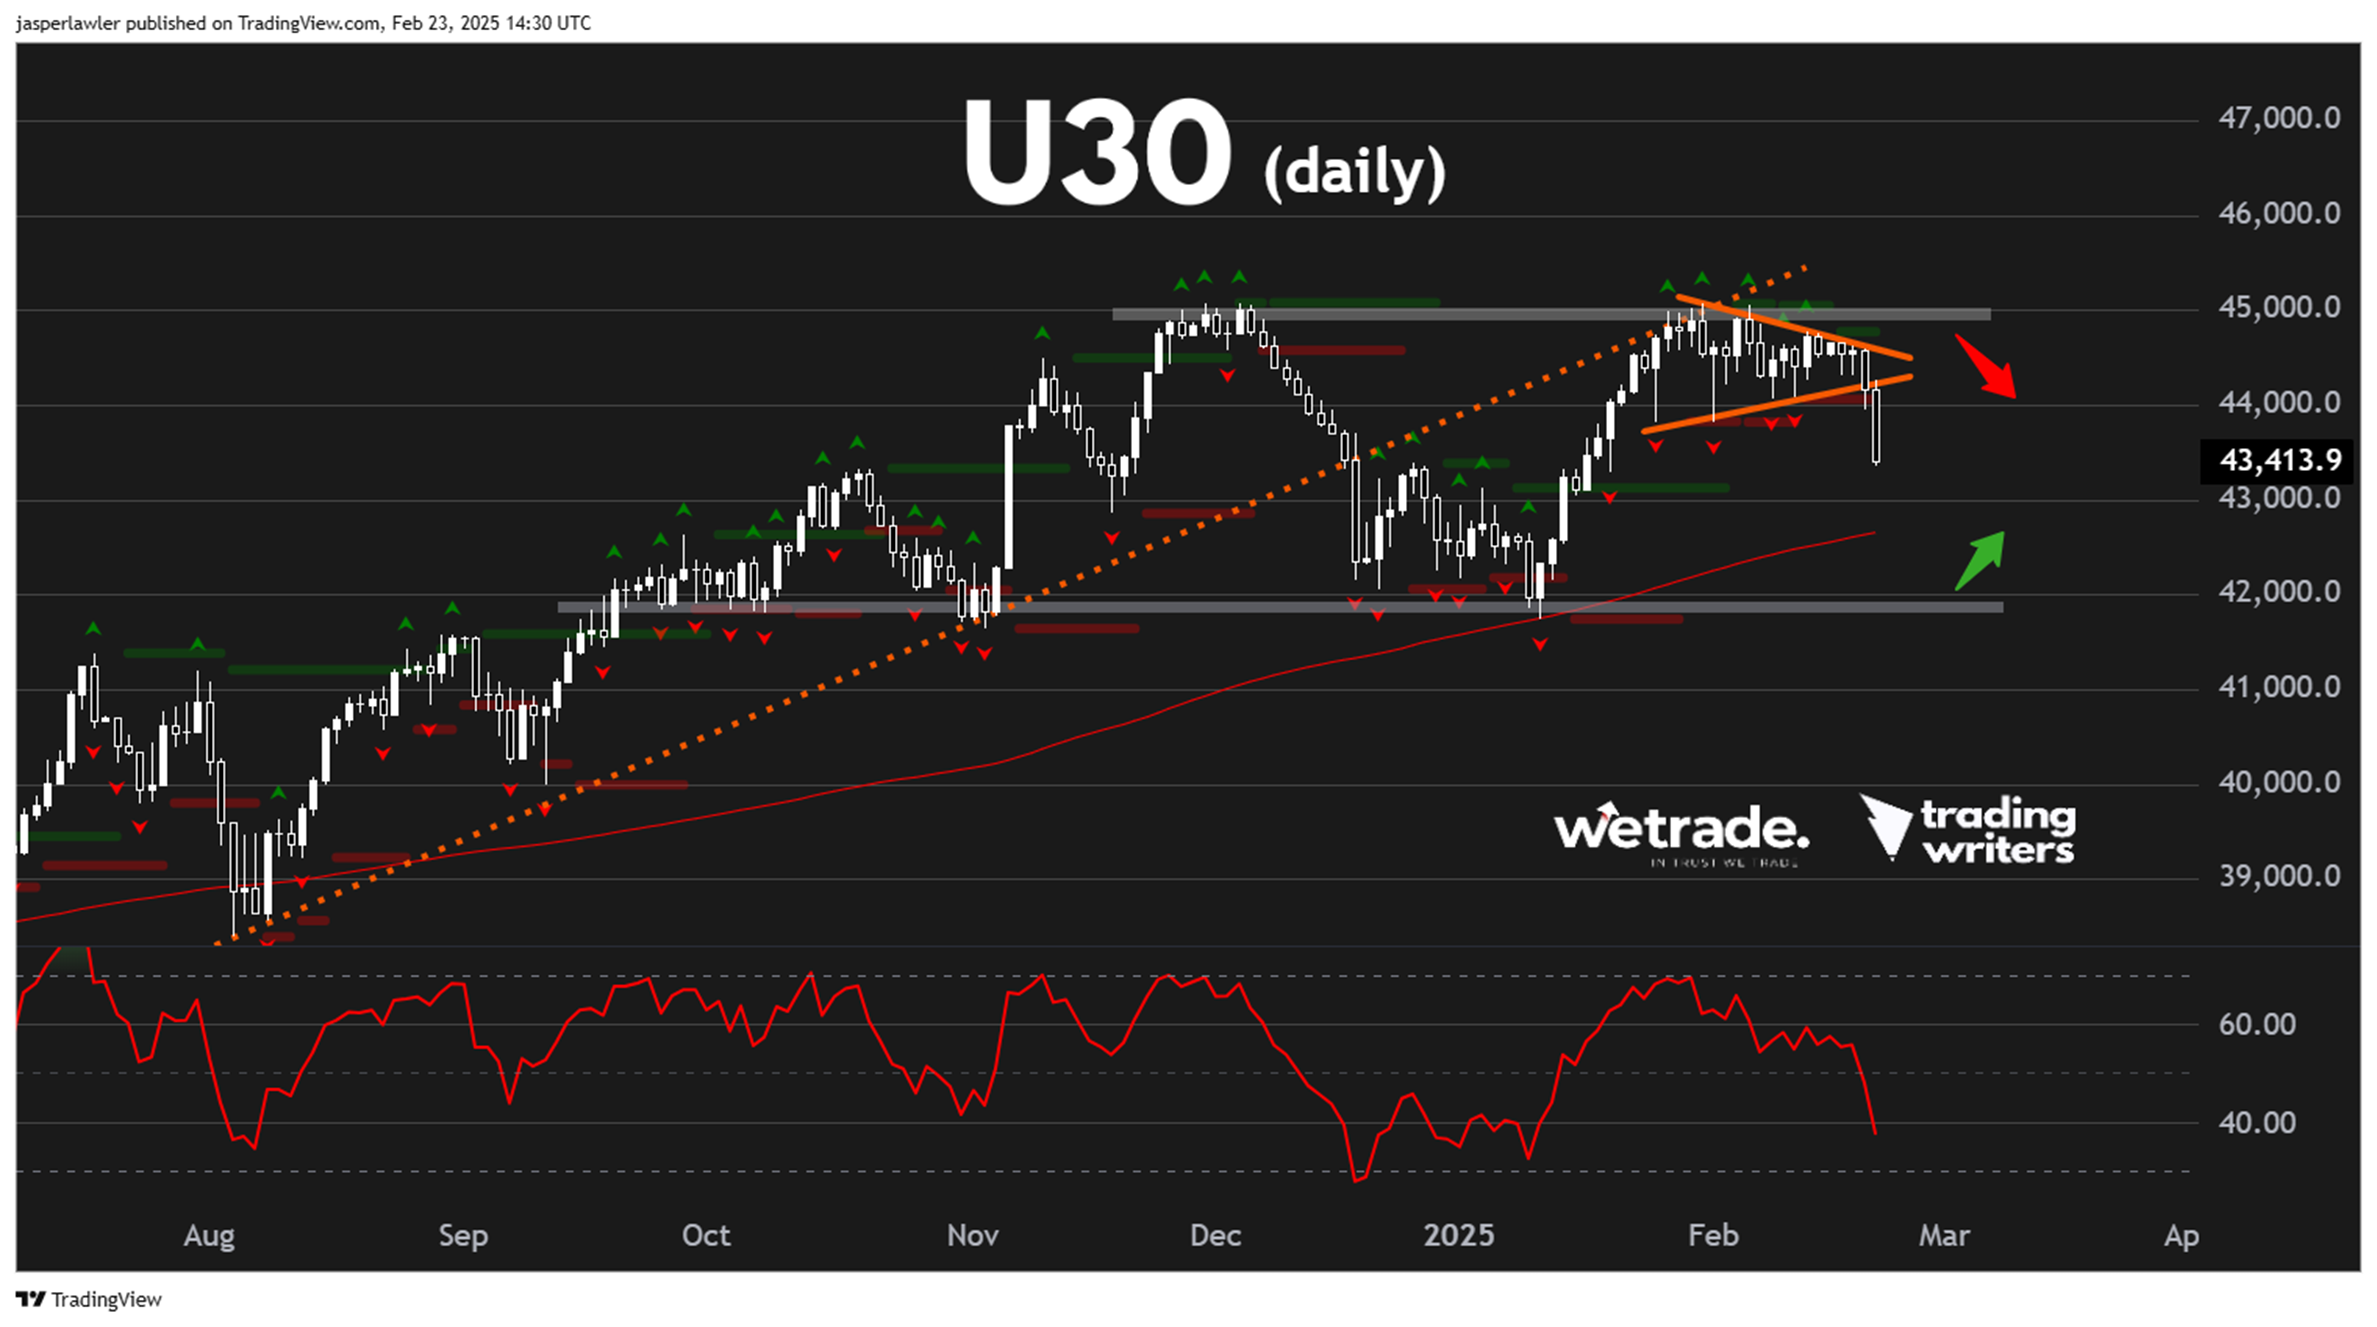
The daily chart is not as clean as I’d ideally like - too many drawings and indicators - but let me try to explain how these are helping me see things.
- At 45,000 there is the double top failure
- There is a broken rising trendline
- A triangle pattern broke lower
- RSI has dropped below 50
- The 30 week moving average is still below the price and rising
- The double top neckline is at 42,000
The short term uptrend has clearly ended but if a new downtrend has started, trading it would mean going against the long term uptrend - which we prefer not to do.
We are happy to treat this as a consolidation - so another rise back towards 44,000 could warrant a sell within the range, while a drop to 42,000 could warrant buying inside the range.
The sign of a major downtrend reversal would be a close under 42,000 and the completion of the double top.
Author

Jasper Lawler
Trading Writers
With 18 years of trading experience, Jasper began his career as a stockbroker on Wall Street in New York City before sharpening his analytical skills at top trading firms in the City of London.


