Looking at the charts: EUR/USD, USD/JPY, USD/CAD, WTI, US500 Cash, XAU/USD

EUR/USD daily chart
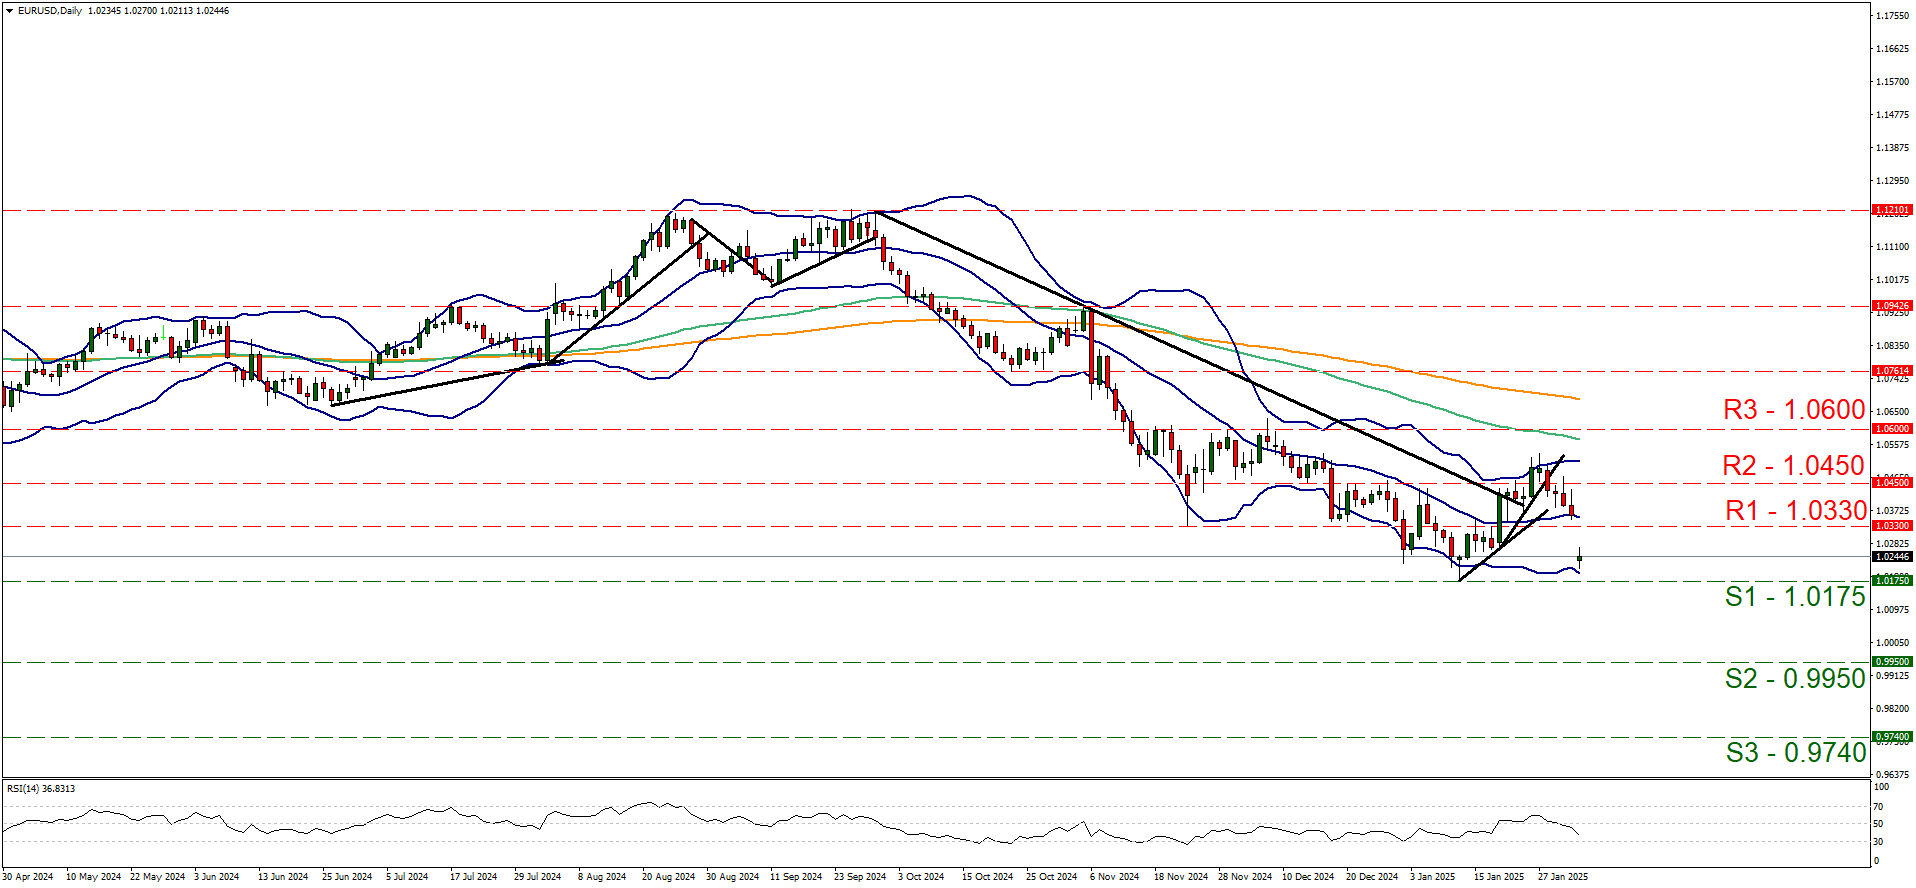
Support: 1.0175 (S1), 0.9950 (S2), 0.9740 (S3).
Resistance: 1.0330 (R1), 1.0450 (R2), 1.0600 (R3).
On a fundamental level, the dovish expectations for the ECB’s intentions, the anemic growth, the intentions of the US administration to impose tariffs on US imports for European products and the relative political instability, all tend to weigh on the common currency. EUR trader’s worries for Trump’s intentions in particular caused EUR/USD to drop substantially breaking the 1.0330 (R1) support line now turned to resistance. Given the intense downward motion and despite that a correction higher may be possible and given the fact that the RSI indicator has moved decisively lower aiming of the reading of 30 and implying a build-up of a bearish sentiment for the pair among market participants. Should the bears maintain control over the pair we may see EUR/USD breaking the 1.0175 (S1) support line and aiming for the 0.9950 (S2) support level. Should the bulls take over, we may see EUR/USD reversing course and breaking the 1.0330 (R1) resistance line and start aiming for the 1.0450 (R2) resistance base.
USD/JPY daily chart
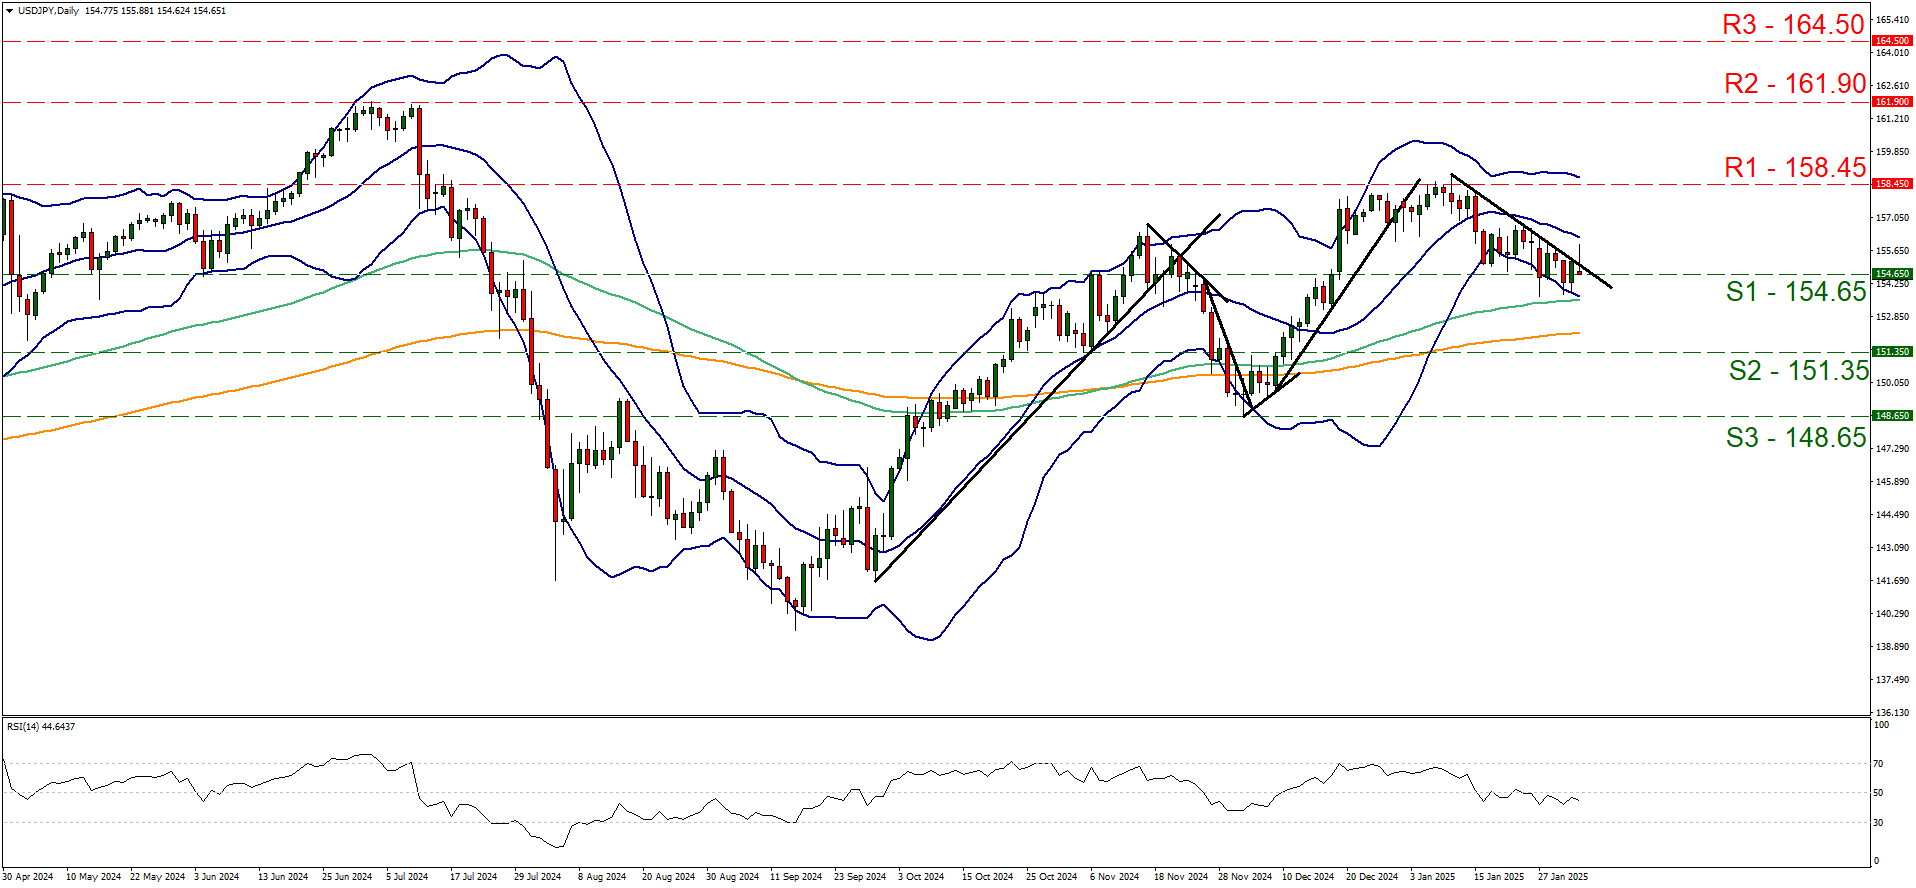
Support: 154.65 (S1), 151.35 (S2), 148.65 (S3).
Resistance: 158.45 (R1), 161.90 (R2), 164.50 (R3).
On a fundamental level the hawkish intentions of BoJ, with the bank seeing scope for more rate hikes after the January meeting may be supporting the Yen. Please note that given the wide uncertainty in the markets, the Japanese currency may also be enjoying some safe haven inflows. On a technical level, USD/JPY has been struggling to break the 154.65 (S1) support line over the past three days. We tend to maintain a bearish outlook for the pair as long as the downward trendline guiding the pair since the 10th of January, at which date it formed its latest peak, remains intact. Also the RSI remains just below the reading of 50, which could imply a slight bearish predisposition on behalf of the market for the pair. Should the bears maintain control over the pair, we may see it breaking the 154.65 (S1) support line clearly, possibly using the S1 as a resistance line and continue lower to aim for the 151.35 (S2) support level. On the flip side, should the bulls take over, we may see the pair reversing course, breaking the prementioned downward trendline in a first signal that the downward motion has been interrupted and continue higher to actively aim if not breach the 158.45 (R1) resistance level, with the next possible target for USD/JPY bulls being the 161.90 (R2) resistance level.
USD/CAD daily chart
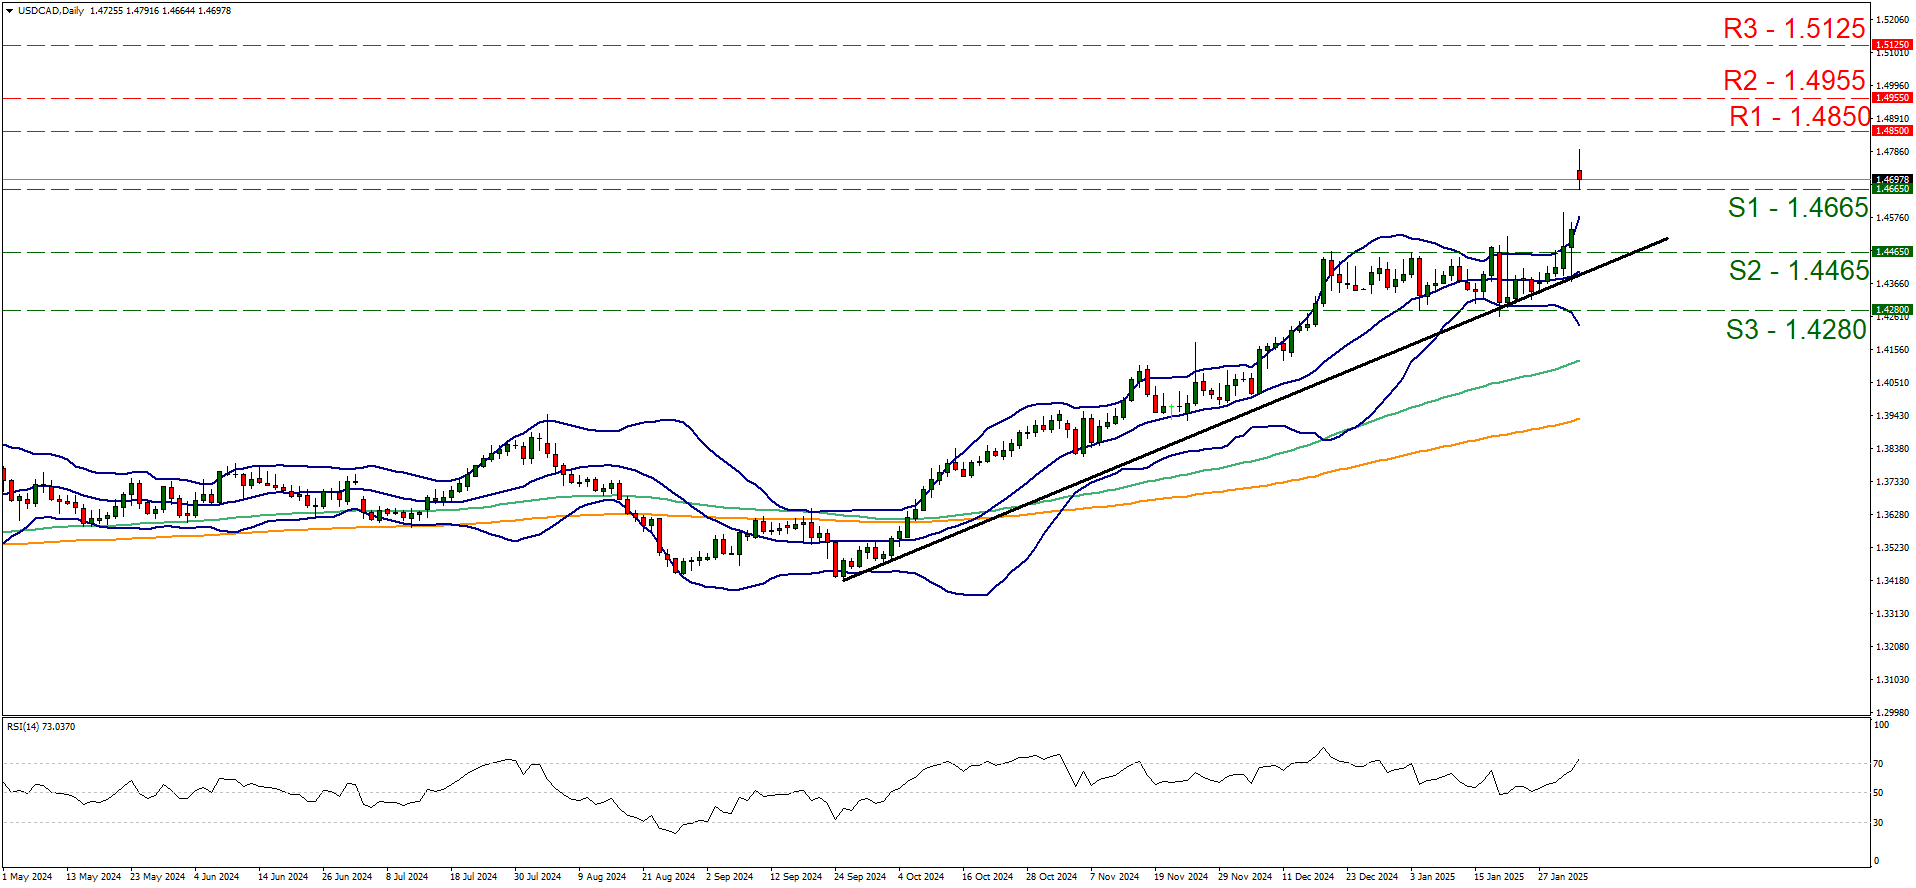
Support: 1.4665 (S1), 1.4465 (S2), 1.4280 (S3).
Resistance: 1.4850 (R1), 1.4955 (R2), 1.5125 (R3).
The decision of the Trump government to activate the tariffs on US imports from Canada by 25%. The decision despite being expected, weighed on the Loonie and at the same time supported the greenback, causing USD/CAD to jump. USD/CAD rallied during today’s Asian session, breaking the 1.4665 (S1) resistance line, now turned to support. We tend to maintain a bullish outlook for the pair as the upward movement allowed us to shift the upward trendline to the right. We also note that the RSI indicator has risen above the reading of 70, implying a strong bullish sentiment among market participants, yet at the same time may be implying that the pair’s price action has reached overbought levels and is ripe for a correction lower. Similar signals are also being send by the fact that USD/CAD’s price action has broken substantially above the upper Bollinger band. Should the bulls continue to lead the pair higher, we would expect it to break the 1.4850 (R1) resistance level, with the next possible target for the pair’s bulls being the 1.4955 (R2) resistance hurdle. For the adoption of a bearish outlook, we would require the pair to break the 1.4665 (S1) support level, break the 1.4465 (S2) support level and continue to break the prementioned upward trendline in a first signal that the upward movement has been interrupted and continue to aim for the 1.4280 (S3) support barrier.
WTI daily chart
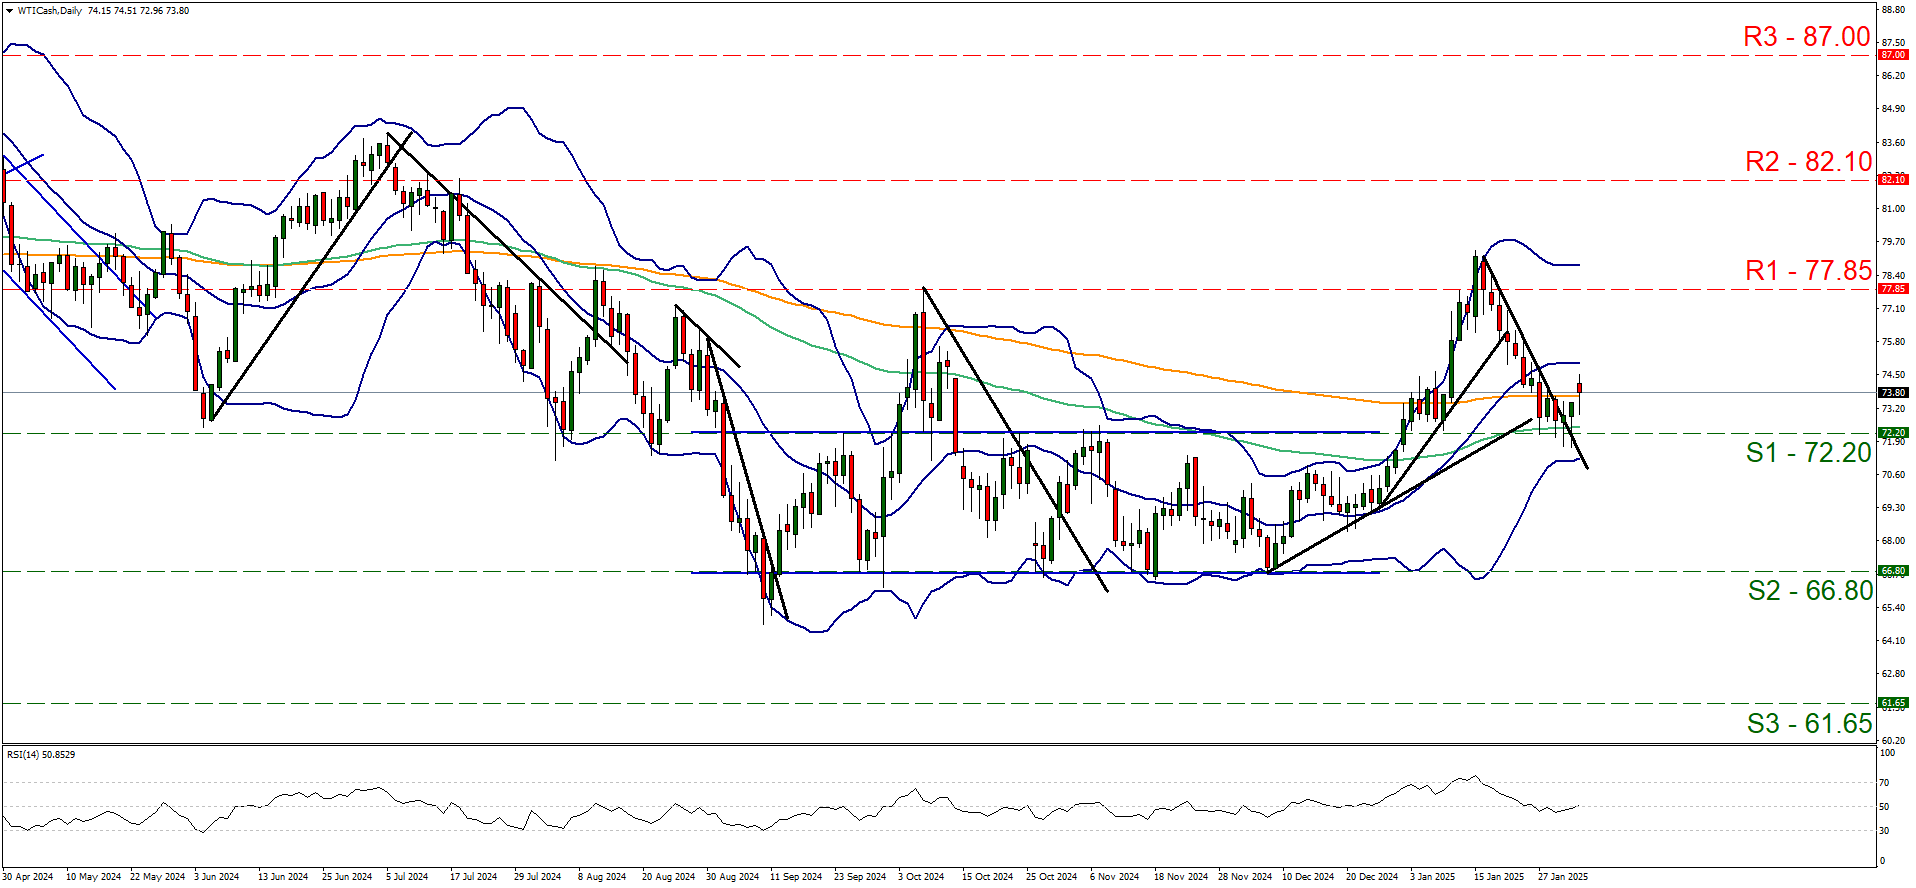
Support: 72.20 (S1), 66.80 (S2), 61.65 (S3).
Resistance: 77.85 (R1), 82.10 (R2), 87.00 (R3).
Oil prices jumped in today’s Asian session, as the market worries for the US tariffs to cause a disruption in oil supply heightened. We also note that the OPEC meeting is to take place today and should the oil producing cartel, decide to slow down the recovery of oil production levels or even decide to keep them low, we may see the decision having a bullish effect on oil prices. On a technical level, we note that the on Friday the price action of oil bounced on the 72.20 (S1) support line breaking the downward trendline signaling an interruption of the downward movement. The RSI indicator corrected higher yet failed to clearly break above the reading of 50 clearly, in a signal that the market may still be indecisive. Hence we maintain for the time being a bias for a sideways motion of the commodity’s price. For a bullish outlook we would require the commodity’s price to break the 77.85 (R1) resistance line and start aiming for the 82.10 (R2) resistance base. On the flip side should the bears retake the initiative over the direction of WTI’s price action, we may see it breaking the 72.20 (S1) support line clearly and start aiming for the 66.80 (S2) support level.
US500 daily chart
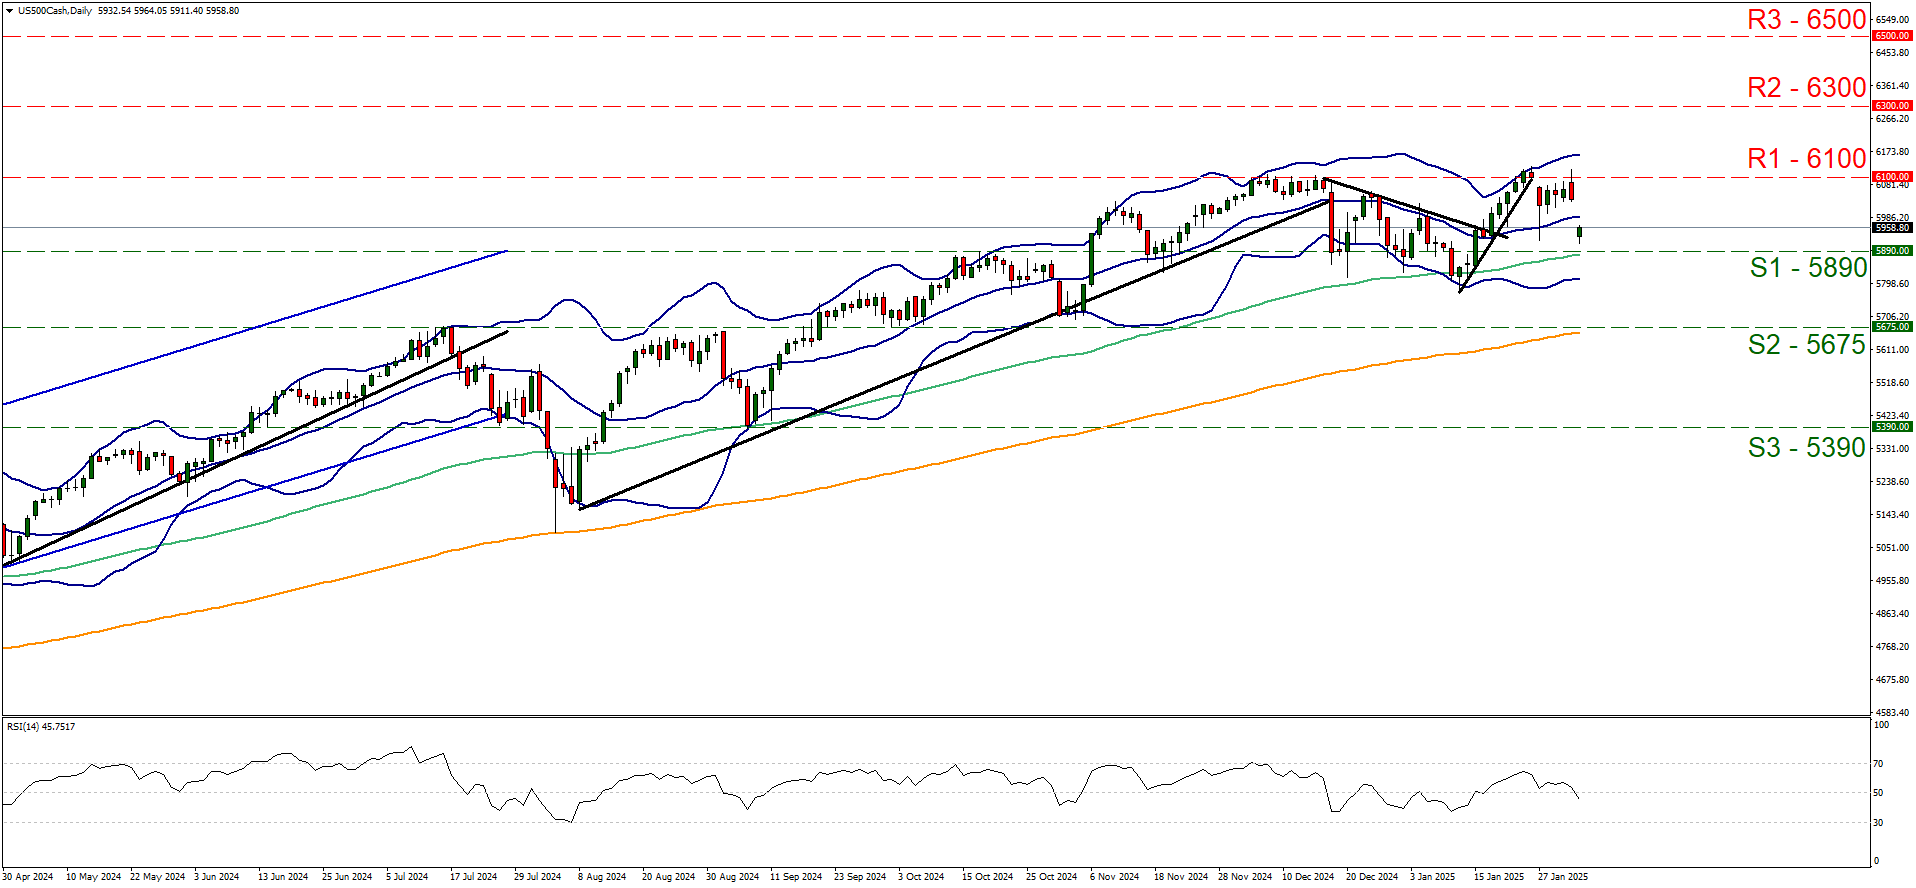
Support: 5890 (S1), 5675 (S2), 5390 (S3).
Resistance: 6100 (R1), 6300 (R2), 6500 (R3).
On a fundamental level, US equities may be influenced by the path of the US earnings season, which is in full swing this week, while the activation of the US tariffs on US imports from China, Canada and Mexico created a wide uncertainty among market participants which weighed on US equities. On a technical level, we note that S&P 500 hit once again a ceiling at the 6100 (R1) resistance line, on Friday, which by the way is a record high level for the index. We tend to maintain our bias for a sideways motion of the index’s price action. A direction that has been followed by the index since the 16th of December last year, when the strong upward trendline was broken. Also the RSI indicator dropped slightly below the reading of fifty, yet remaining unconvincing for now. For a renewal of the bullish outlook of the index, we would require the index’s price action has to enter unchartered waters, breaking the 6100 (R1) resistance line and we set as the next possible target for the bulls the 6300 (R2) resistance level. On the flip side, should the bears take over, we may see the pair falling, breaking the 5890 (S1) support line which and actively aim for the 5675 (S2) support level, while even lower we note the 5390 (S3) support hurdle.
XAU/USD daily chart
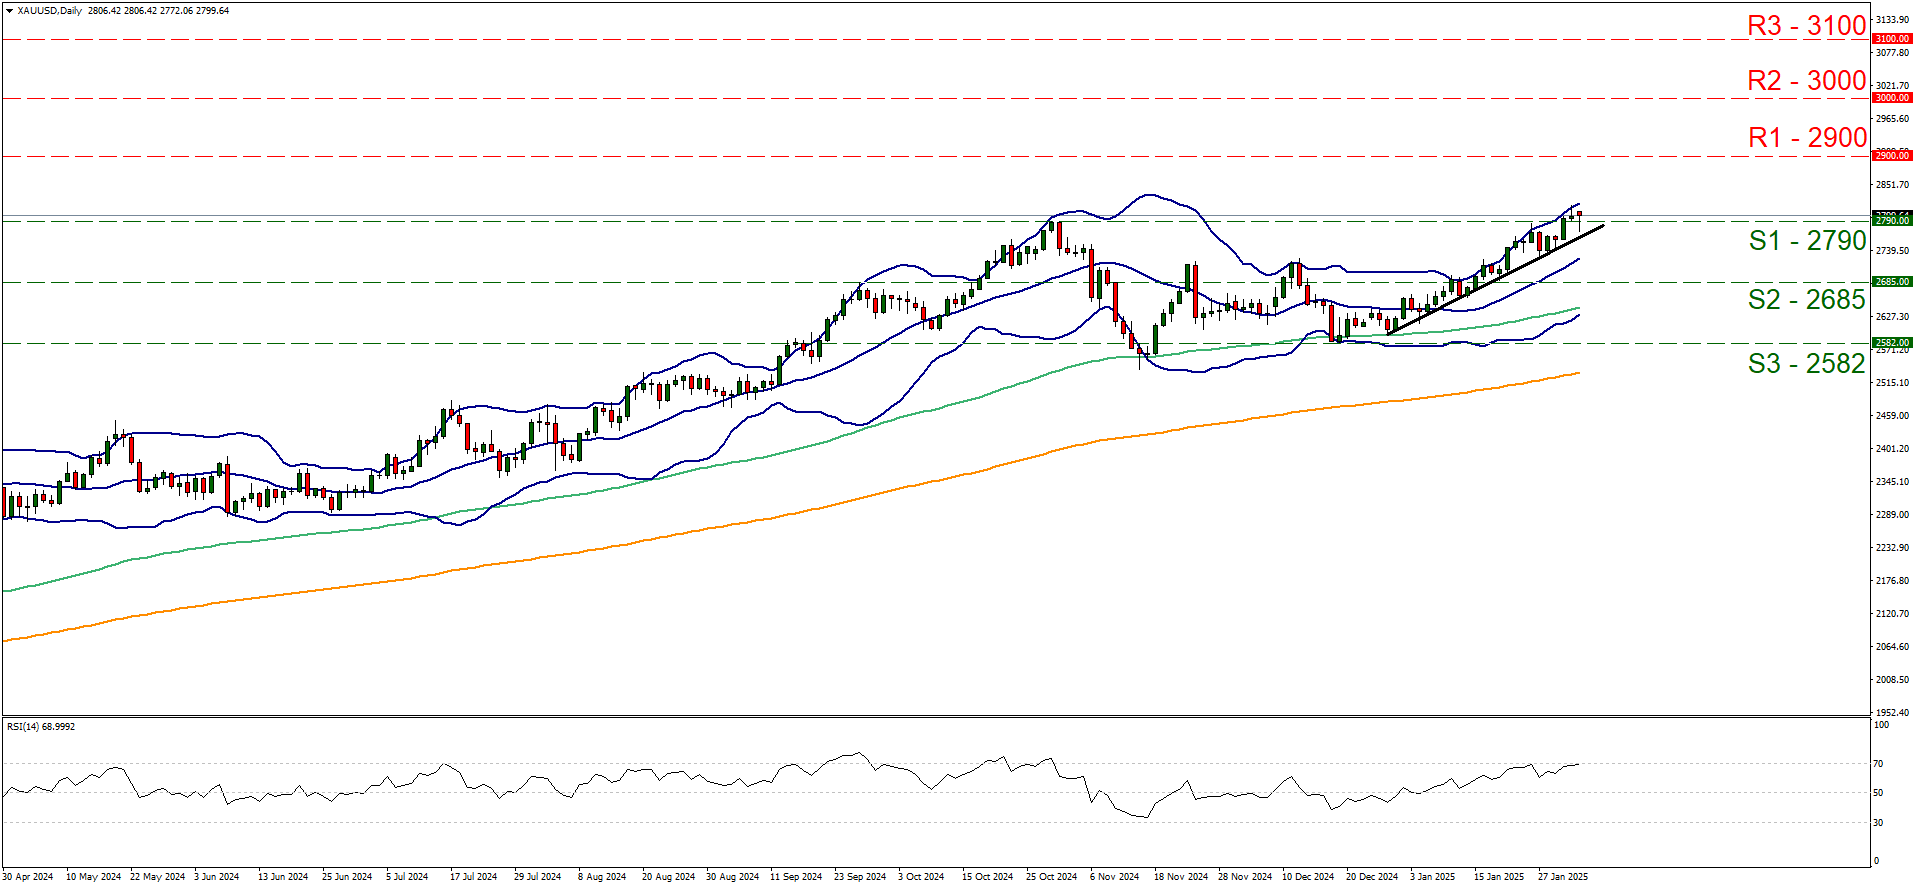
Support: 2790 (S1), 2685 (S2), 2582 (S3).
Resistance: 2900 (R1), 3000 (R2), 3100 (R3).
Gold’s price edged lower yesterday in a rather unconvincing manner, given that the strengthening of the USD could have weighed more on the precious metal’s price, but it did not, allowing for gold’s price to remain in record high levels, just above the former 2790 (S1) resistance line, now turned to support. We maintain a bullish outlook for gold’s price as long as the upward trendline guiding it since the 30th of December last year remains intact. Furthermore we note that the RSI indicator is flirting with the reading of seventy, implying a strong bullish sentiment on behalf of gold traders, yet at the same time may be signaling that the precious metal’s price is nearing overbought levels which could make it ripe for a correction lower. Similar signals are being send by the fact that gold’s price action is constantly testing the upper Bollinger band. Should the bulls maintain control over the precious metal’s price we may see it aiming of the 2900 (R1) resistance line. For a bearish outlook we would require gold’s price to reverse direction, break the 2790 (S1) support line, break the prementioned upward trendline in a first signal that the upward motion has been interrupted and continue lower, taking aim off the 2685 (S2) support base.
Author

Peter Iosif, ACA, MBA
IronFX
Mr. Iosif joined IronFX in 2017 as part of the sales force. His high level of competence and expertise enabled him to climb up the company ladder quickly and move to the IronFX Strategy team as a Research Analyst. Mr.


