Looking at the charts: EUR/USD, USD/JPY, GBP/USD, USD/CAD

EUR/USD daily chart
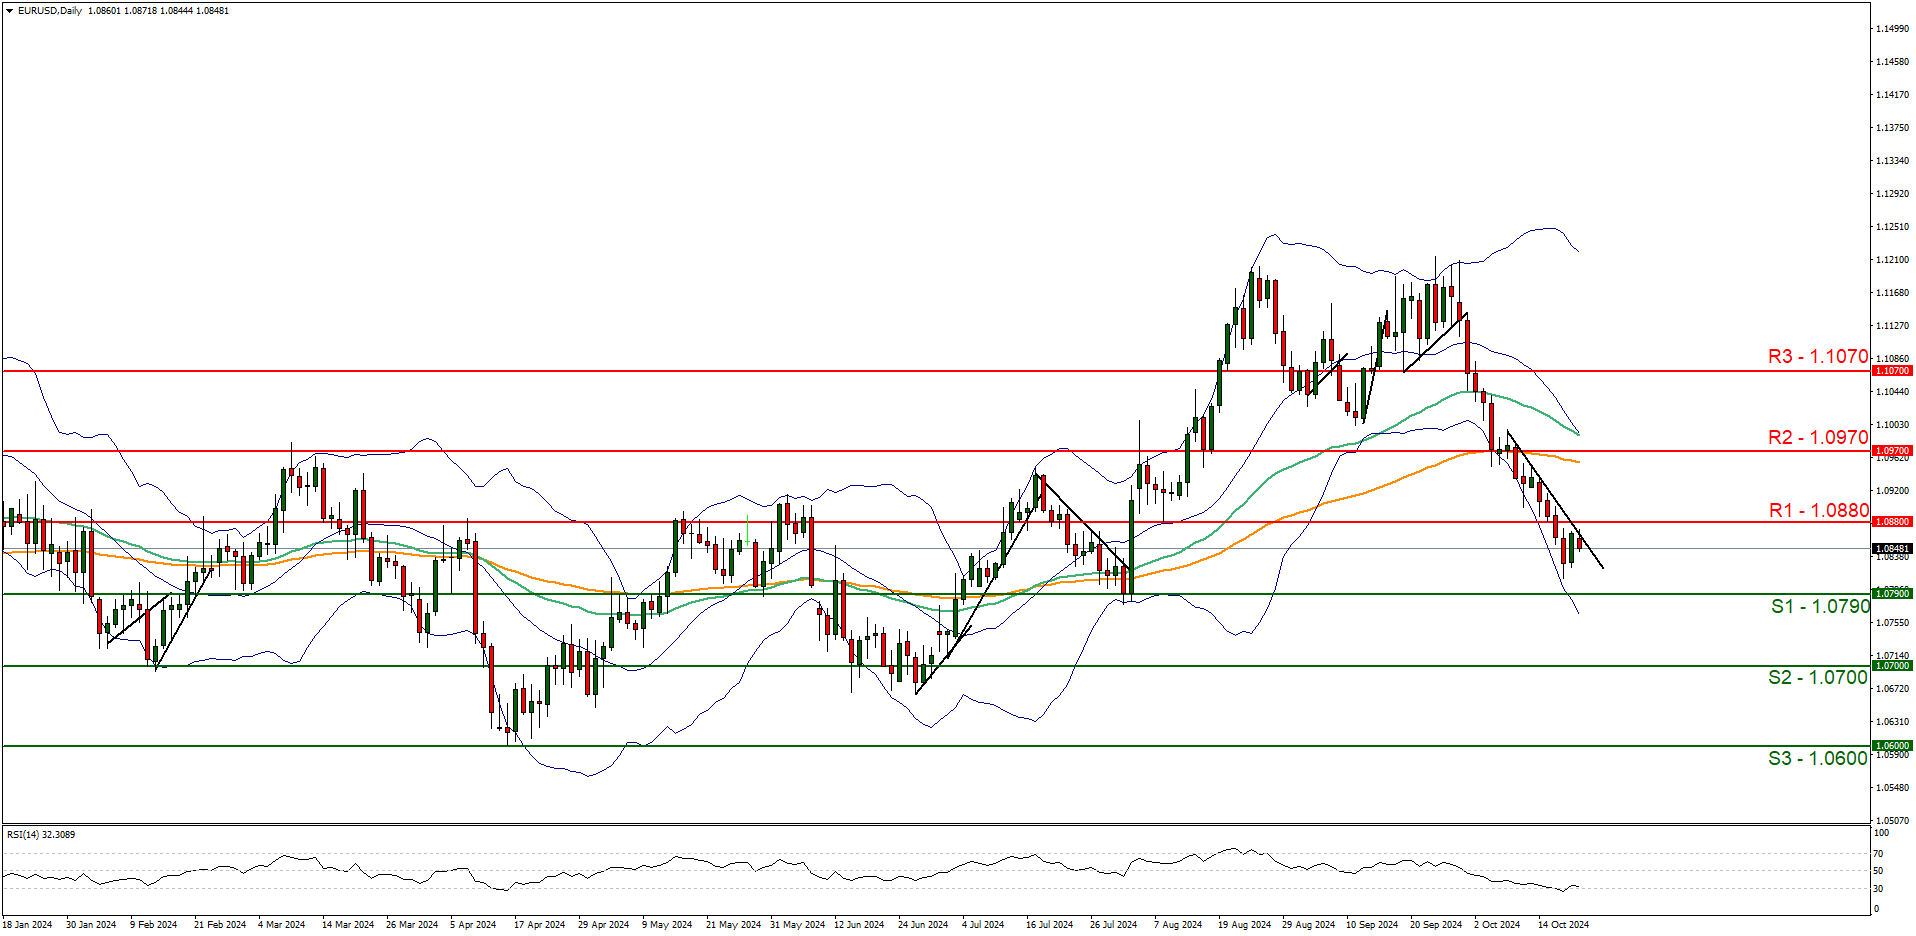
Support: 1.0790 (S1), 1.0700 (S2), 1.0600 (S3).
Resistance: 1.0880 (R1), 1.0970(R2), 1.1070(R3).
EUR/USD started the week in the reds, with the pair having broken below our support turned to resistance at the 1.0880 (R1) level. We opt for a bearish outlook for the pair and supporting our case is the downwards-moving trendline which was incepted on the 8th of September, in addition to the RSI indicator below our chart which currently registers a figure near 30, implying a strong bearish market sentiment. For our bearish outlook to continue, we would require a clear break below the 1.0790 (S1) support level, with the next possible target for the bears being the 1.0700 (S2) support line. On the flip side, for a sideways bias we would require the pair to remain confined between the 1.0790 (S1) support level and the 1.0880 (R1) resistance line. Lastly, for a bullish outlook, we would require a clear break above the 1.0880 (R1) resistance line, with the next possible target for the bulls being the 1.0970 (R2) resistance level.
USD/JPY daily chart
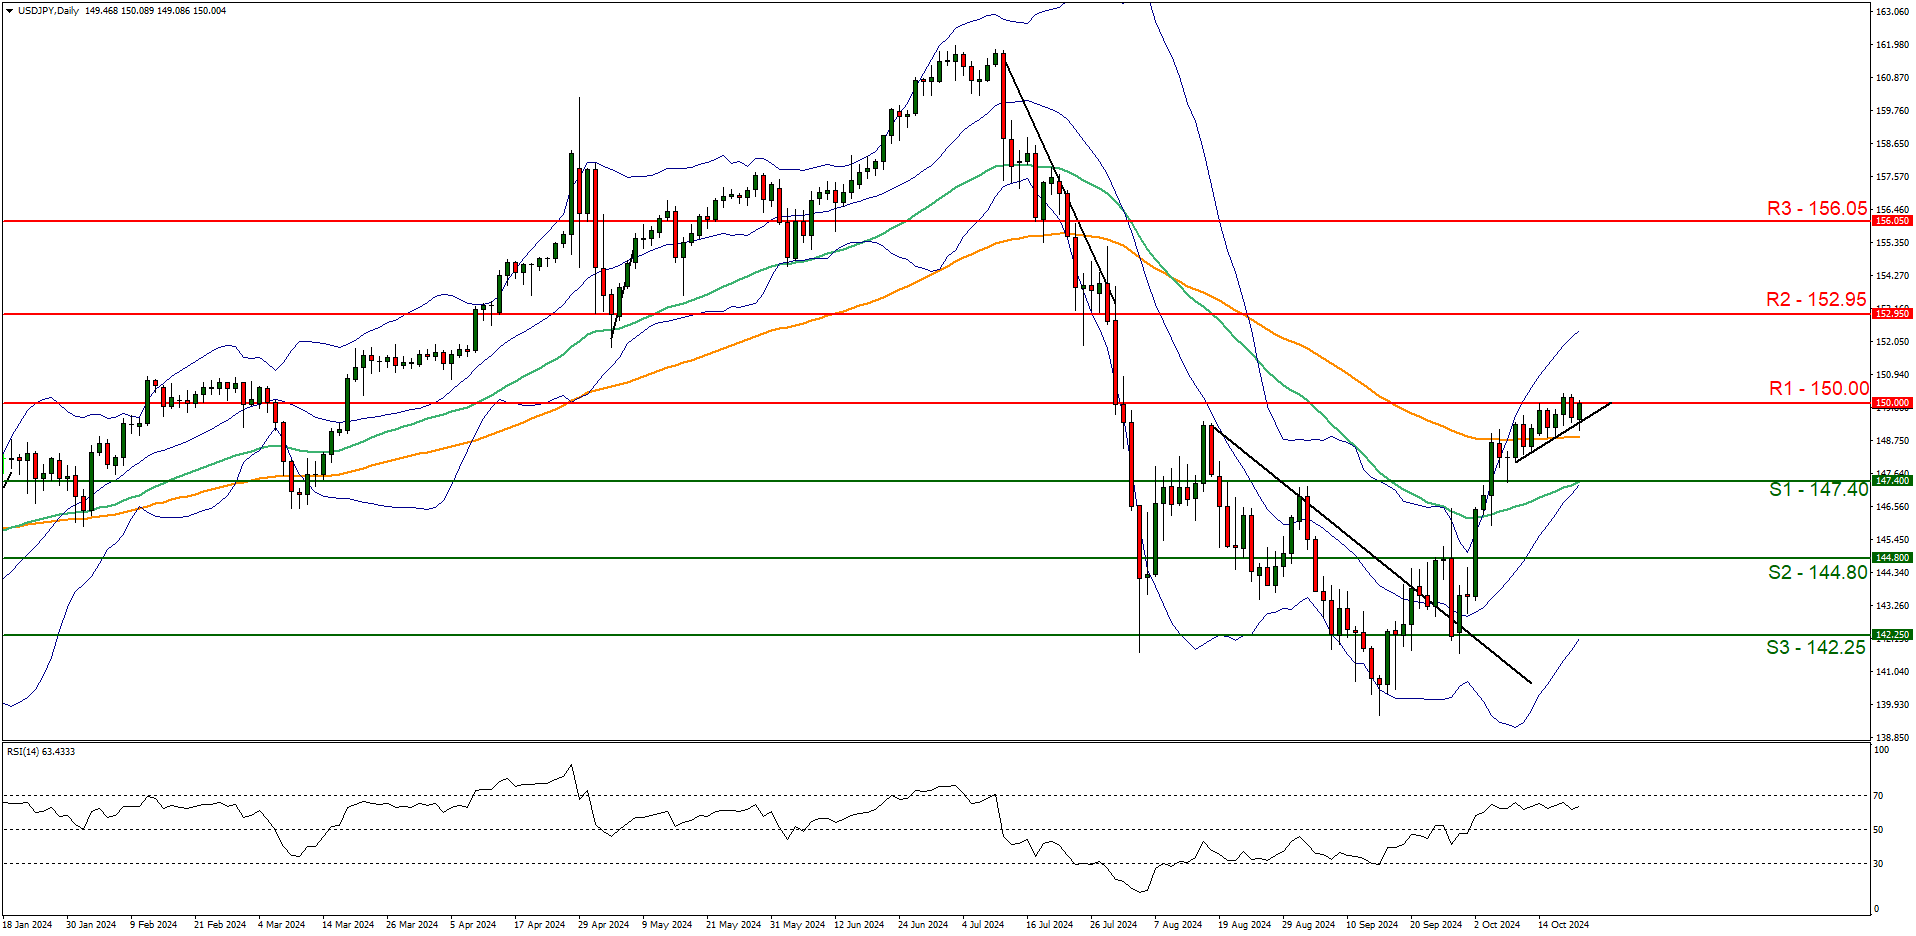
Support: 147.40 (S1), 144.80 (S2), 142.25(S3).
Resistance: 150.00 (R1), 152.95 (R2), 156.05 (R3).
USD/JPY appears to be moving in a upwards fashion, having broken above our last report’s R1 and R2 resistance levels, which have now turned to support levels. We opt for a bullish outlook for the pair and supporting our case is the RSI indicator below our chart which currently registers a figure above 60, implying a bullish market sentiment, in addition to the upwards moving trendline which was incepted on the 9TH of October. For our bullish outlook to continue, we would require a clear break above the 150.00 (R1) resistance level, with the next possible target for the bulls being the 152.95 (R2) resistance line. On the flip side for sideways bias we would require the pair to remain confined between the sideways moving channel defined by the 147.40 (S1) support level and the 150.00 (R1) resistance line. Lastly, for a bearish outlook, we would require a clear break below the 147.40 (S1) support level, with the next possible target for the bears being the 144.80 (S2) support line.
GBP/USD daily chart
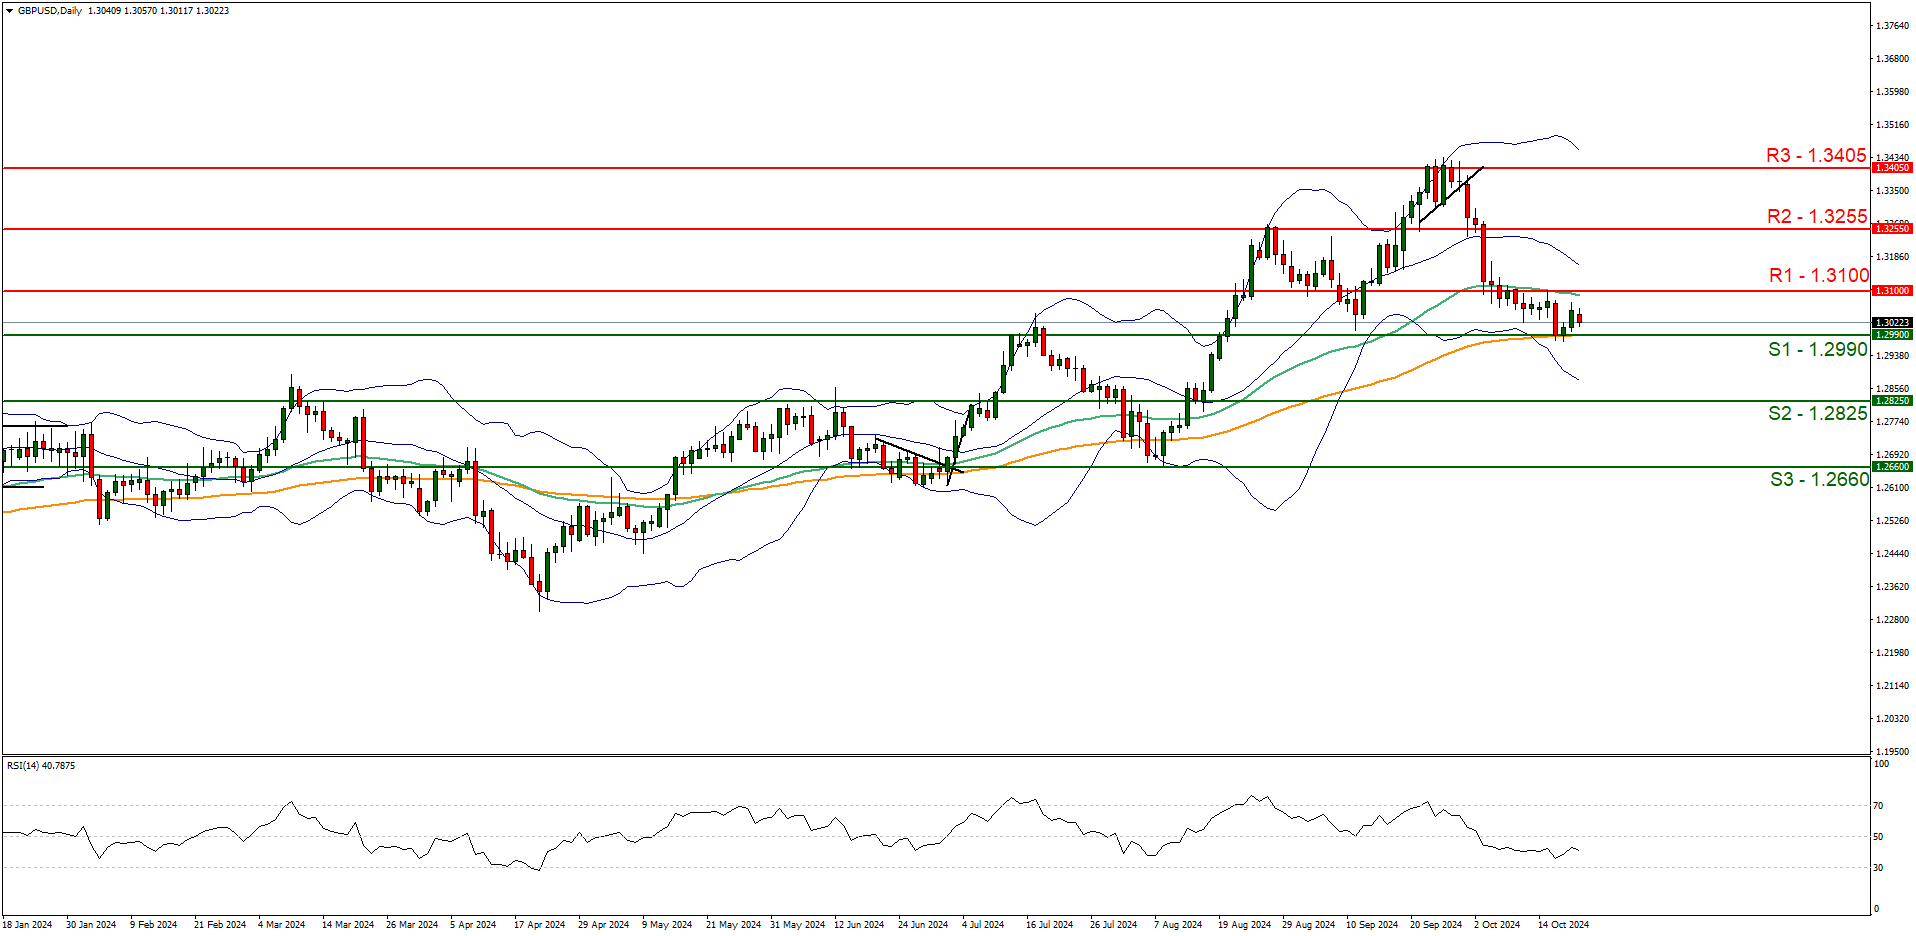
Support: 1.2990 (S1), 1.2825 (S2), 1.2660 (S3).
Resistance: 1.3100 (R1), 1.3255 (R2), 1.3405 (R3).
GBP/USD appears to be moving in a downwards fashion, despite bouncing off our 1.2990 (S1) support level. We opt for a bearish outlook for the pair and supporting our case is the RSI indicator below our chart which currently registers a figure of roughly 40, implying a bearish market sentiment. For our bearish outlook to continue, we would require a clear break below the 1.2990 (S1) support level, with the next possible target for the bears being the 1.2825 (S2) support line . On the flip side, for a sideways bias we would require the pair to remain confined between the sideways moving channel defined by the 1.2990 (S1) support level and the 1.3100 (R1) resistance line. Lastly, for a bullish outlook, we would require a clear break above the 1.3100 (R1) resistance level, with the next possible target for the bulls being the 1.3255 (R2) resistance line.
USD/CAD daily chart
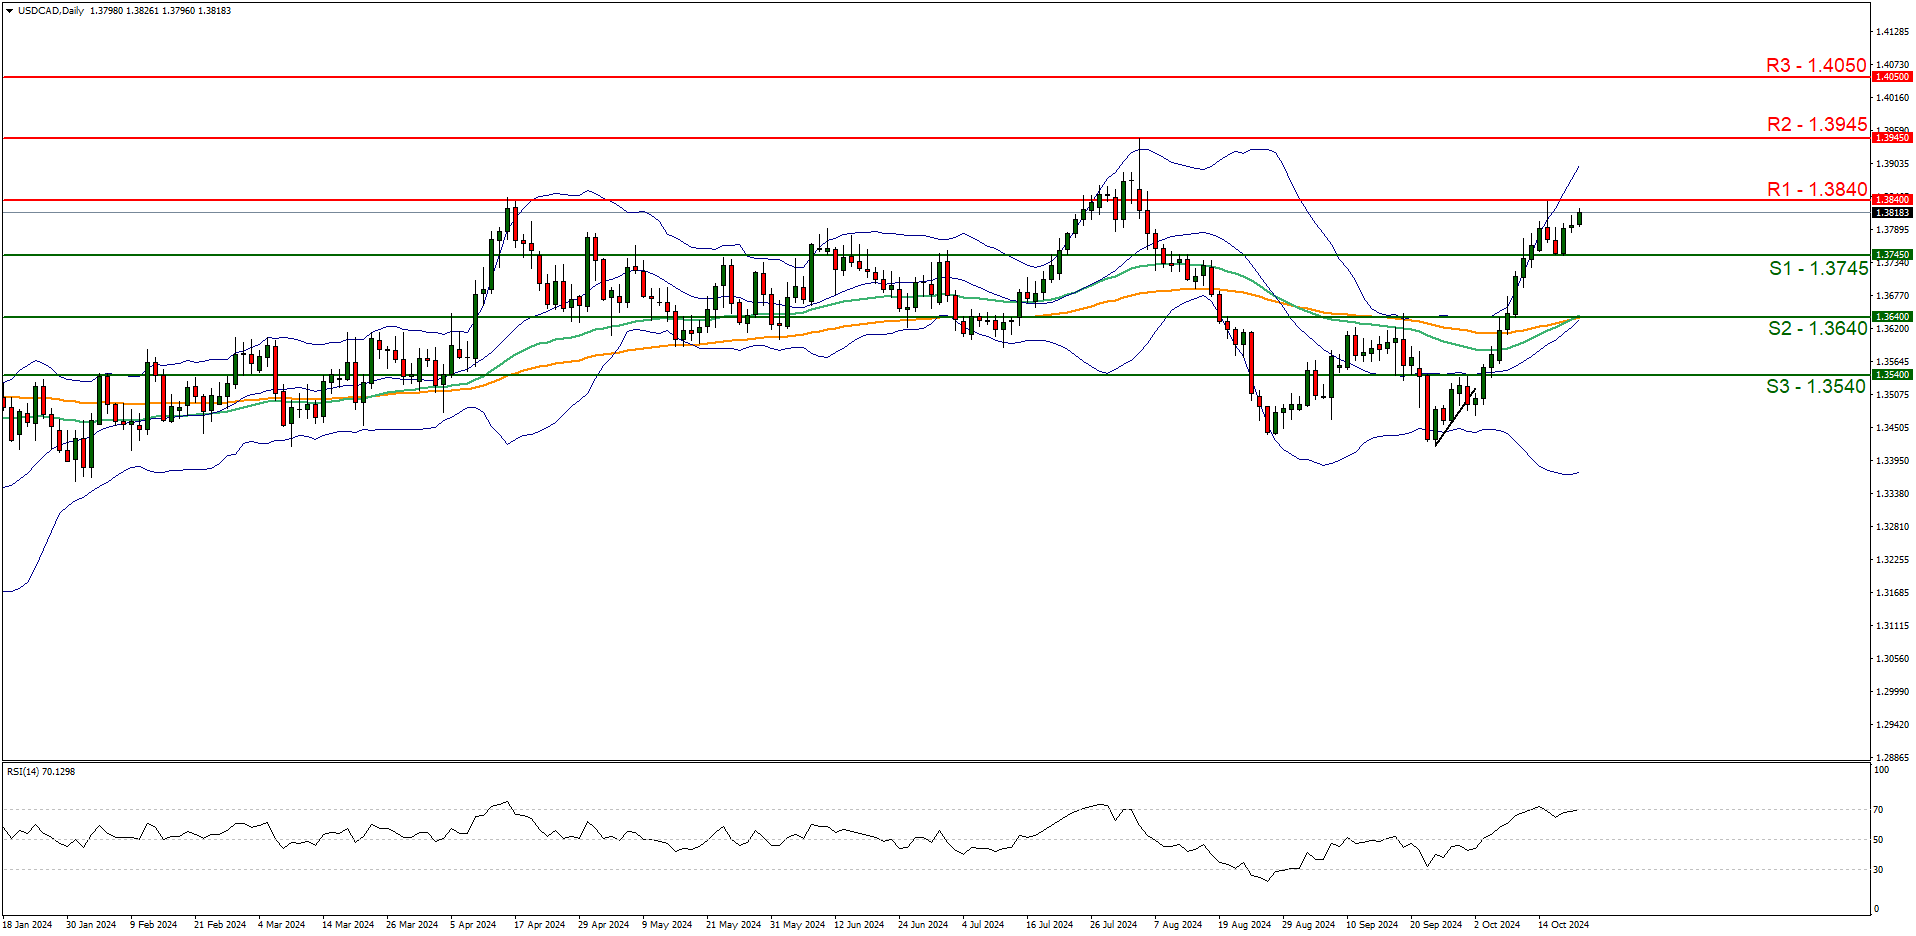
Support: 1.3745 (S1), 1.3640 (S2), 1.3540 (S3).
Resistance: 1.3840 (R1), 1.3945 (R2), 1.4050 (R3).
USD/CAD appears to be moving in an upwards fashion with the pair currently appearing to be taking aiming for the 1.3745 (R1) resistance level. We opt for a bullish outlook for the pair and supporting our case is the RSI indicator below our chart which currently registers a figure of 70, implying a strong bullish market sentiment in addition to the 50MA crossing above the 100MA essentially implying a bullish market sentiment as well. For our bullish outlook to continue we would require a clear break above the 1.3840 (R1) resistance level, with the next possible target for the bulls being the 1.3945 (R2) resistance level. On the flip side for a sideways bias we would require the pair to remain confined between the 1.3745 (S1) support level and the 1.3840 (R1) resistance line. Lastly, for a bearish outlook we would require a clear break below the 1.3745 (S1) support level with the next possible target for the bears being the 1.3640 (S2) support line.
Author

Phaedros Pantelides
IronFX
Mr Pantelides has graduated from the University of Reading with a degree in BSc Business Economics, where he discovered his passion for trading and analyzing global geopolitics.


