LMT Showing Elliott Wave Impulse Structure From All Time Lows

Lockheed Martin Corp (NYSE: LMT) is the largest defense, aerospace and advanced technologies company based in the United States employs approximately 105000 people worldwide. The company operates mainly on four business segments i.e Aeronautics, Missiles & Fire control, Rotary & Mission system and Space systems. It’s the world’s largest defense contractor based on revenues in the fiscal year of 2014.
So far the stock that has seen a price change of 16.25% so far this year. Currently paying a dividend of $2.2 per share, the company has a dividend yield of 2.89%. In comparison, the Aerospace defense industry’s yield is 0.96%, while the S&P 500’s yield is 1.96%. The company’s current annualized dividend of $8.80 is up 7.3% from last year. In the past five-year period, Lockheed Martin has increased its dividend 5 times on a YOY basis for an average annual increase of 10.57%. Indicating a highly optimistic Future ahead which could attract more investors.
However, in this blog, we will be taking a look at the technical picture of the stock using the Elliott wave theory to identify future price action in the stock below.
LMT Weekly Elliott Wave Chart

Looking at Weekly chart, the cycle from all-time lows is unfolding in powerful impulse Elliott wave structure in Grand Super Cycle degree. Looking to extend higher towards $391.06-$437.50 in 5 waves structure to end the cycle from Oct 1999 low in wave ((III)). And then from there, the stock is expected to see a bigger 3 wave pullback in Grand Super Cycle degree wave ((IV)) before next round of rally starts.
LMT Daily Elliott Wave Chart
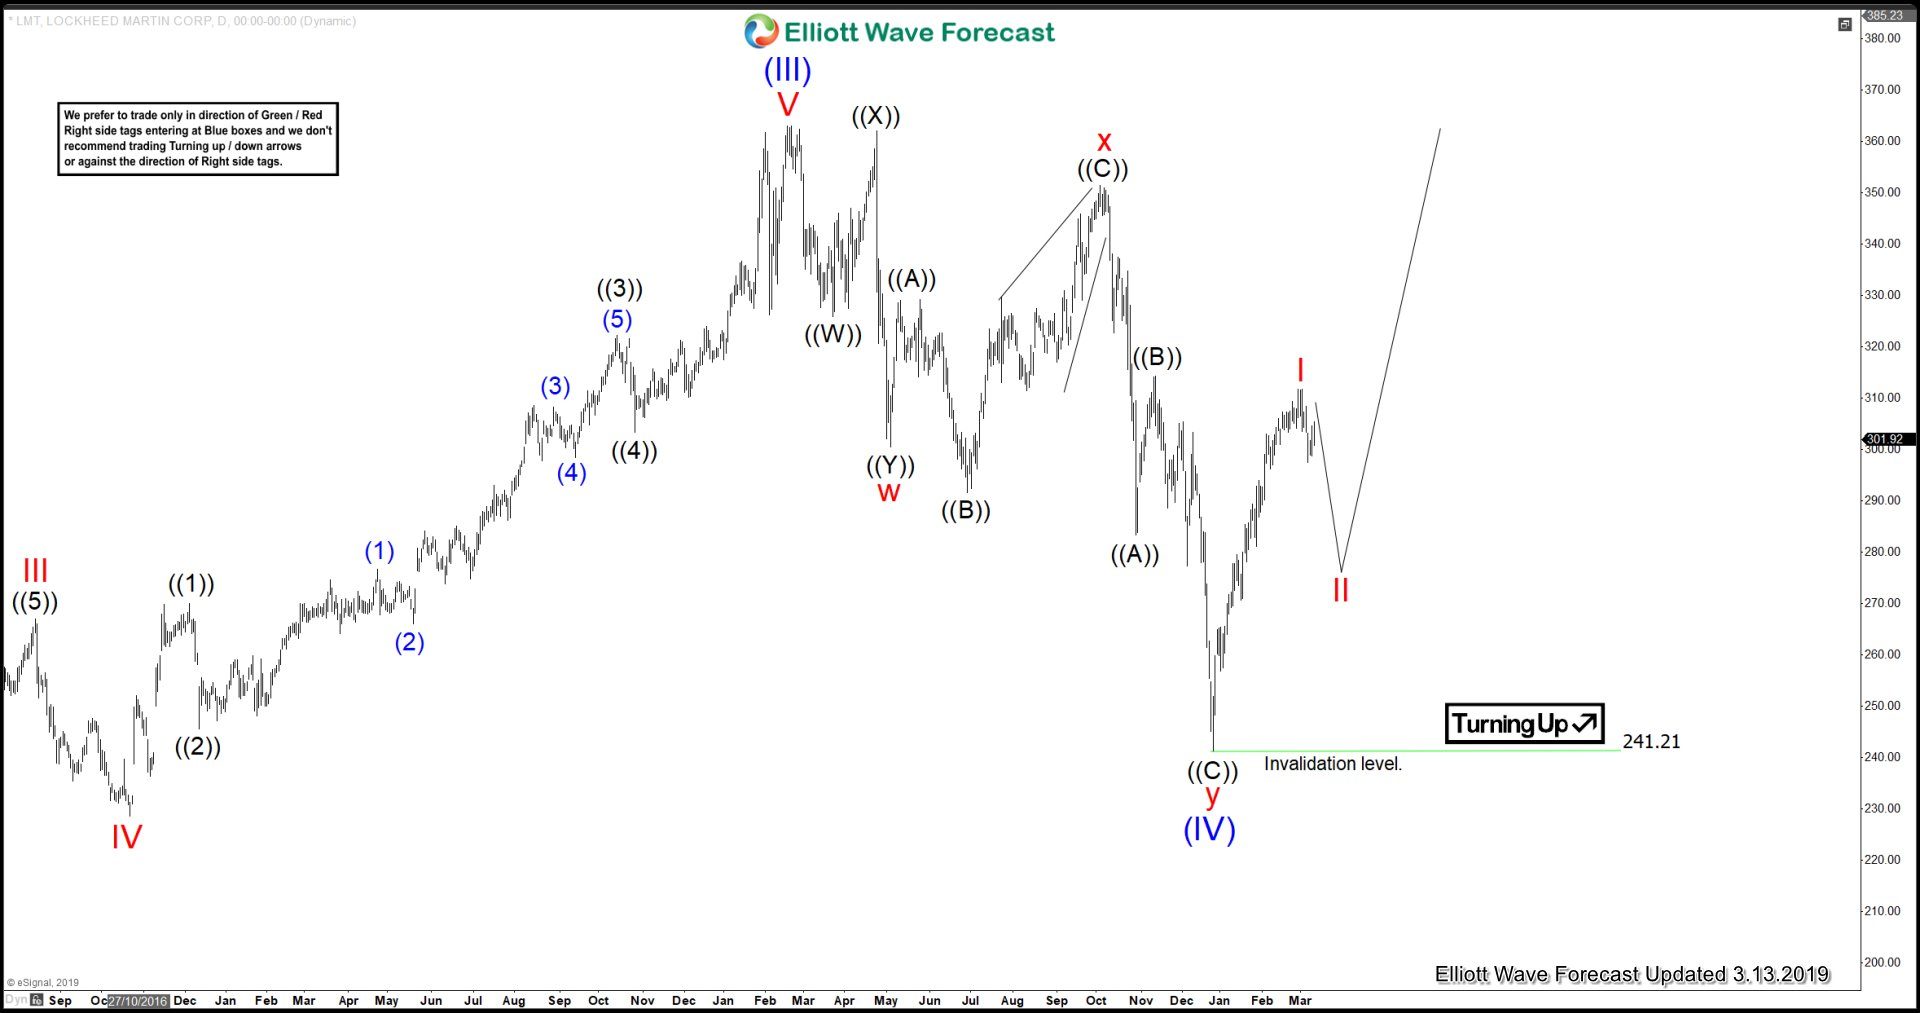
Now looking at Daily Chart, the cycle from 2/16/2018 peak ended the correction against March 2009 low in Super Cycle degree wave (IV) at $241.21 low as double three structure. While dips remain above $241.21 low, the stock is expected to resume the upside in Super Cycle degree wave (V) before completion of wave ((III)) can take place. However, a break above 2/16/2018 peak ( $363) still needed to confirm the next move higher towards $391.06-$437.50 area & avoid double correction lower from the peak.
LMT 4 Hour Elliott Wave Chart
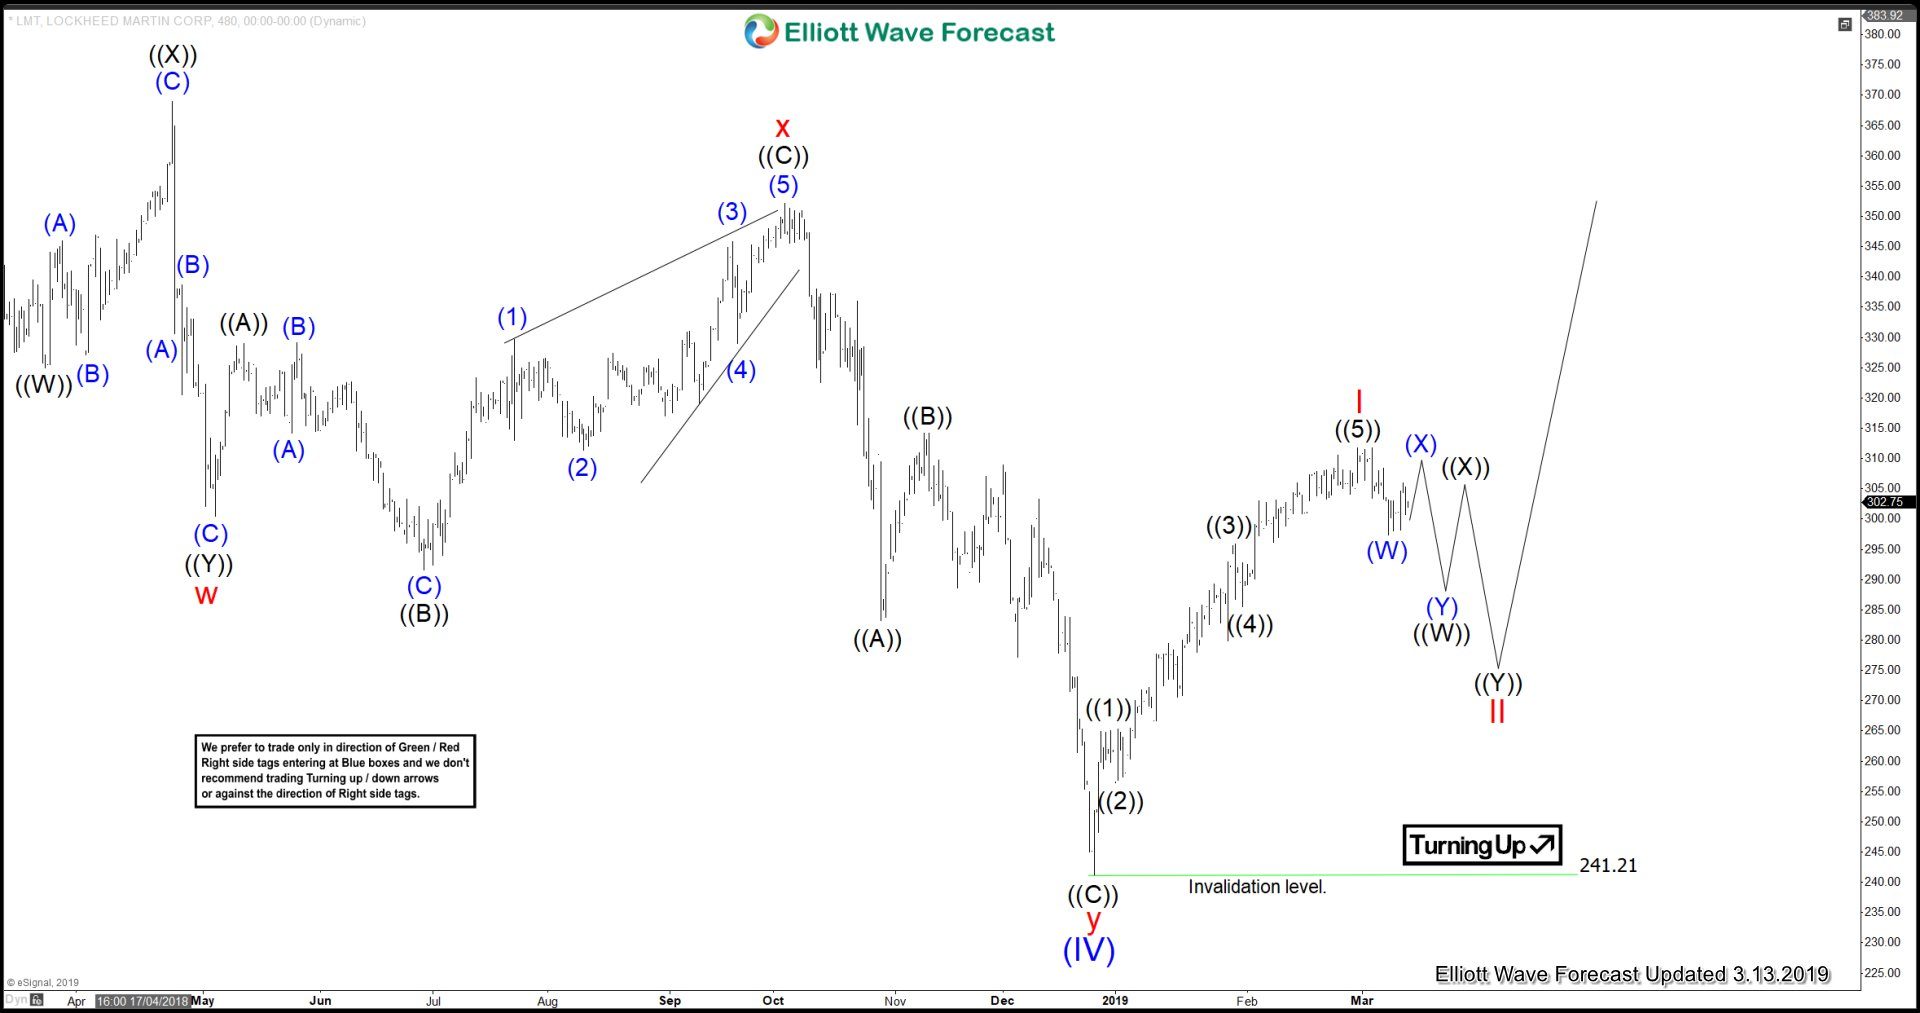
In conclusion, the cycle from all-time lows is showing incomplete impulse structure in Grand Super Cycle degree in longer-term view. Suggesting that the bulls should remain in control looking for more upside either against $241.21 low or against $58.54 March 2009 low. While in short-term price action the stock still needs to clear & see a break above 2/16/2018 peak ($363) peak to confirm the next extension higher.
LMT Elliott Wave Alternative View
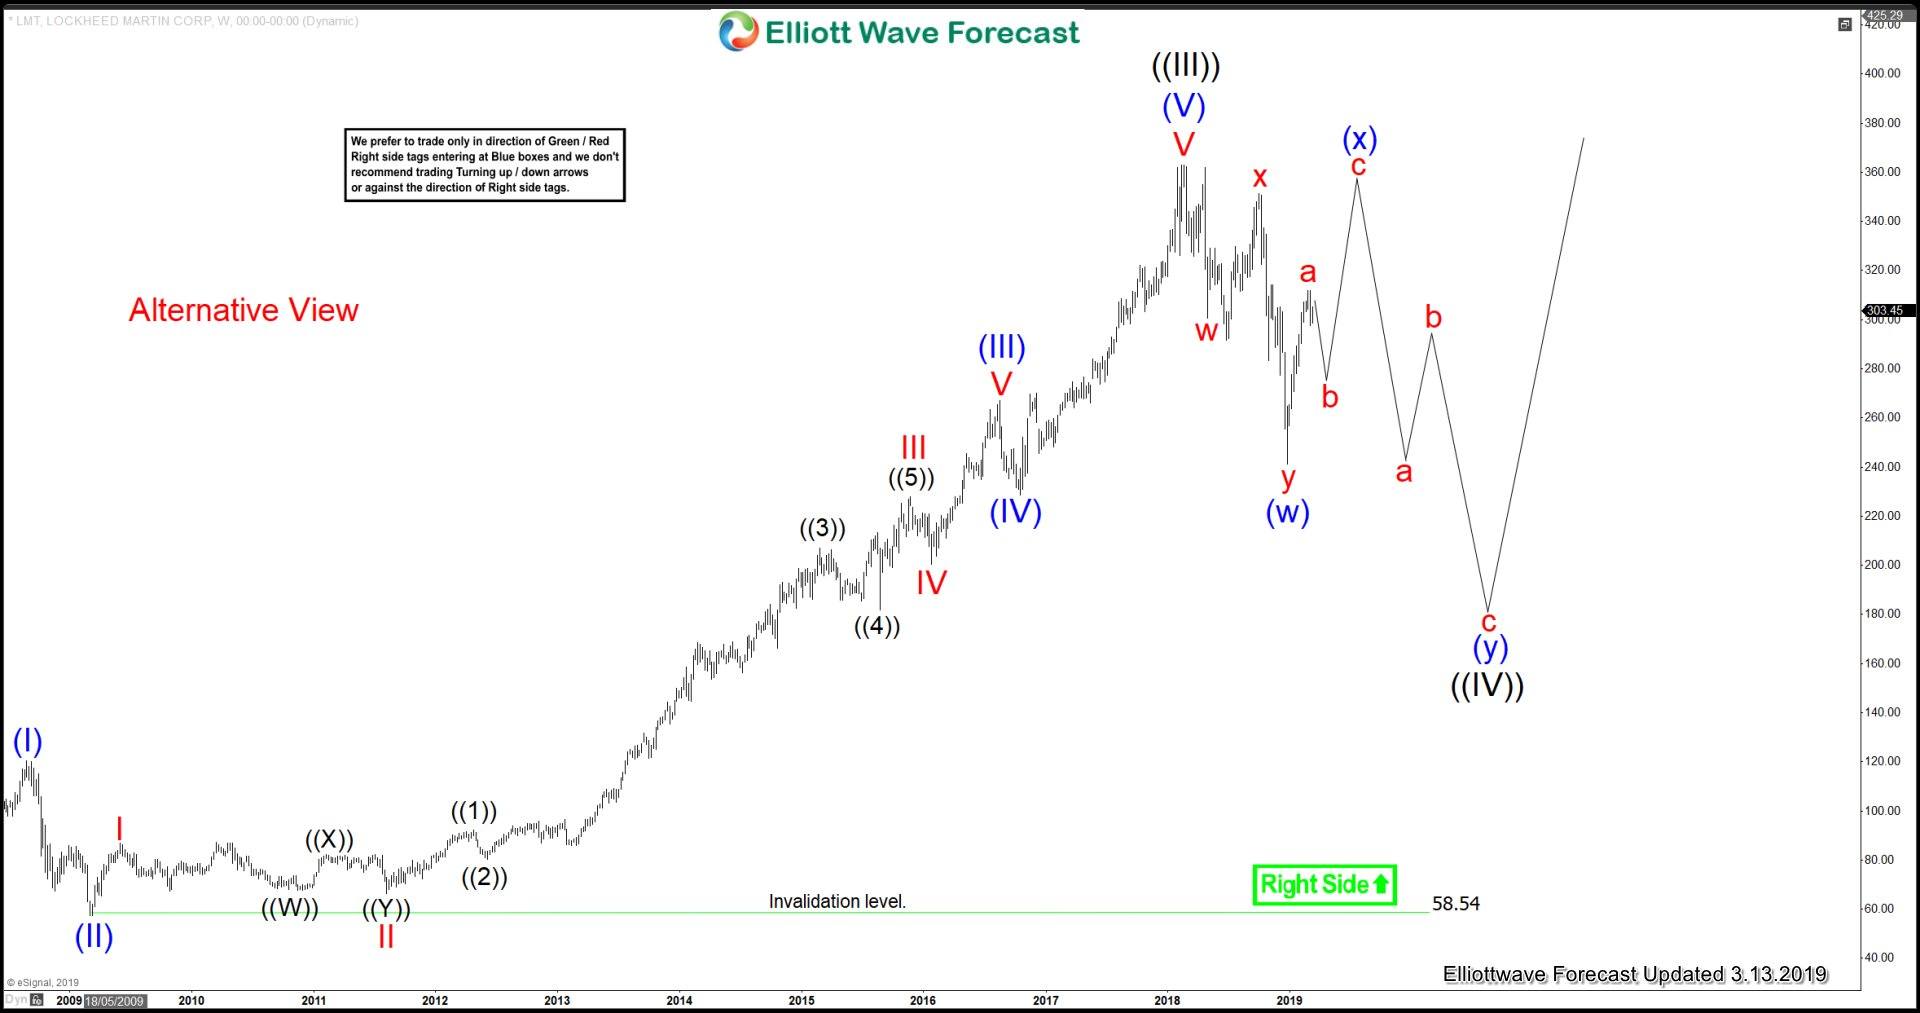
Above is the alternative view in Weekly time frame, in which instead of making new highs the stock can fail below 2/16/2018 peak ($363) peak. It may do a double correction lower and end up correcting bigger cycle from November 1999 low in Grand Super Cycle degree wave ((IV)) before resuming higher again.
Become a Successful Trader and Master Elliott Wave like a Pro. Start your Free 14 Day Trial at - Elliott Wave Forecast.
Author

Elliott Wave Forecast Team
ElliottWave-Forecast.com


