Liberation day?

USD: Jun '25 is Down at 103.850.
Energies: May '25 Crude is Down at 70.79.
Financials: The Jun '25 30 Year T-Bond is Higher by 1 tick and trading at 118.20.
Indices: The Jun '25 S&P 500 emini ES contract is 128 ticks Lower and trading at 5642.00
Gold: The Jun'25 Gold contract is trading Up at 3148.00
Initial conclusion
This is not a correlated market. The USD is Down and Crude is Down which is not normal, but the 30 Year T-Bond is trading Higher. The Financials should always correlate with the US dollar such that if the dollar is Higher, then the bonds should follow and vice-versa. The S&P is Lower and Crude is trading Lower which is not correlated. Gold is trading Higher which is correlated with the US dollar trading Down. I tend to believe that Gold has an inverse relationship with the US Dollar as when the US Dollar is down, Gold tends to rise in value and vice-versa. Think of it as a seesaw, when one is up the other should be down. I point this out to you to make you aware that when we don't have a correlated market, it means something is wrong. As traders you need to be aware of this and proceed with your eyes wide open. Asia traded mainly Lower with the exception of the Hang Seng and Singapore exchanges. However, all of Europe is trading Lower.
Possible challenges to traders
-
ADP Non-Farm Employment Change is out at 8:15 AM EST. This is Major.
-
Factory Orders m/m is out at 10 AM EST. This is Major.
-
Crude Oil Inventories is out at 10:30 AM EST. This is Major.
-
President Trump Speaks at 4 PM EST. This is Major.
Traders, please note that we've changed the Bond instrument from the 10 Year (ZN) to the 2 Year (ZT). They work exactly the same.
We've elected to switch gears a bit and show correlation between the 2-year Treasury notes (ZT) and the S&P futures contract. The YM contract is the Dow Jones Industrial Average, and the purpose is to show reverse correlation between the two instruments. Remember it's likened to a seesaw, when up goes up the other should go down and vice versa.
Yesterday the ZT veered Lower at around 8:20 AM EST with no real economic news to speak of at that time. The Dow moved Higher at the same time. Look at the charts below and you'll see a pattern for both assets. The Dow moved Higher at 8:20 AM EST and the ZT moved Lower at around the same time. These charts represent the newest version of Bar Charts, and I've changed the timeframe to a 15-minute chart to display better. This represented a Short opportunity on the 2-year note, as a trader you could have netted about 20 plus ticks per contract on this trade. Each tick is worth $6.25. Please note: the front month for ZT is now Jun '25 and the Dow is Jun '25 as well. I've changed the format to filled Candlesticks (not hollow) such that it may be more apparent and visible.
Charts courtesy of BarCharts
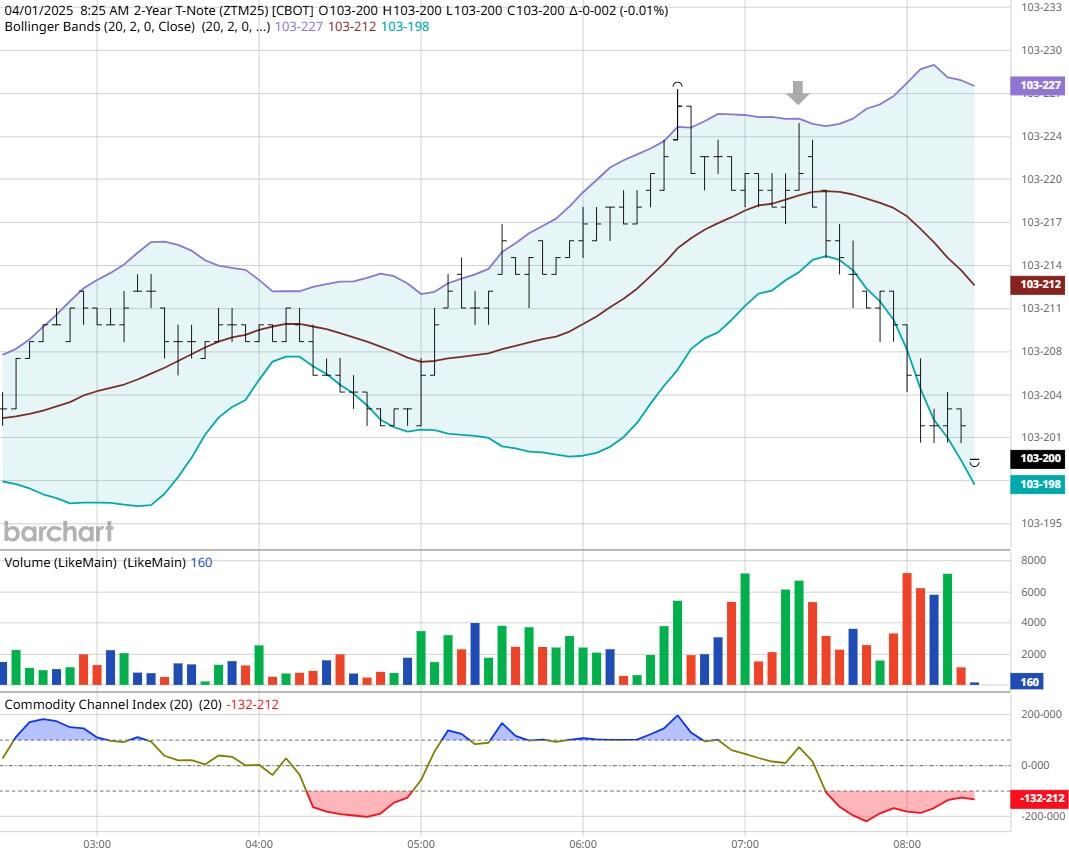
ZT -Jun 2025 - 4/01/25
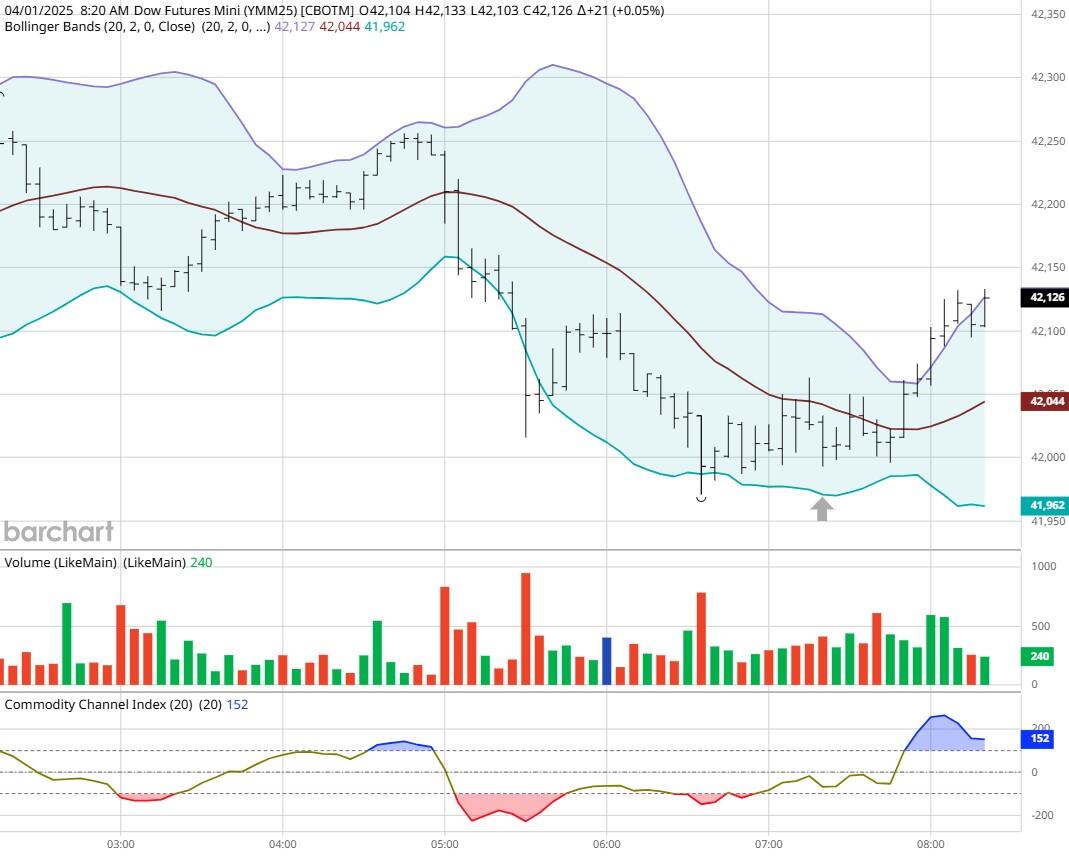
Dow - Mar 2025- 4/01/25
Bias
Yesterday we gave the markets a Downside bias as both the USD and Bonds were trading Higher Tuesday morning and that usually represents a Down Day. The markets didn't disappoint as the Dow fell by 231 points and the other indices lost ground as well. Today we aren't dealing with a correlated market, and our bias is Neutral or Mixed.
Could this change? Of Course. Remember anything can happen in a volatile market.
Commentary
So "Liberation" Day is finally here but I suspect that the only liberation will be freeing our money from our wallets. Someone in this administration should study business history a bit more. The Smoot-Hawley Act was passed shortly after the Stock Market Crashed in 1929 and it made an economic recession even worse and that morphed into the Great Depression which no one wants to see again. The stock market actually appeared to be rebounding in 1930 but then this act was passed in June 1930 and prices for imported goods increased in which no one could afford. Bank runs were rampant at that time as there was no Federal Reserve system in place yet. No one has figured out that we the people actually pay those tariffs because it isn't a foreign government that pays; it's the supplier or manufacturer of those items being imported that pay and guess what they will do to augment those higher costs? Raise prices. Want to learn Market Correlation and determine market direction hours before the Opening Bell?
Author

Nick Mastrandrea
Market Tea Leaves


