Last week was a big ‘whipsaw’

Weekly thoughts
The last week can probably best be described as a ‘whipsaw’.
There was a huge rebound in stock market indices, gold hit record highs again and the US dollar took a major tumble, benefitting the euro the most.
A whipsaw in markets refers to a situation where the price of any market moves sharply in one direction, giving the impression of a clear trend, but then quickly reverses and moves sharply in the opposite direction. This kind of movement can "whip" traders in and out of positions - hence the term "whipsaw."
Probably the craziest, most damaging (and no doubt profitable for some!) whipsaw in my career as a forex trader was the Swiss franc depegging on January 15, 2015. I was working for a brokerage who fortuitously was big enough and with strong enough risk controls to manage the crisis. Other brokers weren't so lucky and went out of business. Some of you trading back then will know which ones!
What happened was not just a whipsaw but pure market dislocation. The EUR/CHF floor at 1.2000 had been in place since 2011. The Swiss National Bank had committed to defending that level with interventions, and the market believed them. For years, many traders ran mean-reversion strategies, fading dips towards 1.2000, treating it almost like a fixed boundary.
The closer EUR/CHF got to 1.2000, the more appealing the long setup became. You’d go long just above the peg, with a tight stop underneath, banking on the SNB stepping in to push the price back up. The week prior to the cris, EUR/CHF had hit its highest in 3 months- so the strategy had worked well up to that point. It was a strategy built on the assumption of central bank support—what could go wrong?
Everything.
When the SNB unexpectedly removed the floor, EUR/CHF reversed off its highs and plunged in seconds—dropping from around 1.2000 to as low as 0.8500. Liquidity completely evaporated. There was no gradual move, no chance for most stops to be filled as intended. Not only that, the market whipsawed off the lows and within days had retraced over half the move down.
We will cover EUR/CHF in this week’s setups.
Getting back to last week, just as stock investors were fearing a major crash across markets - there was an abrupt turnaround when Donald Trump announced a 90-day pause to most tariffs. Stock market bears were whipsawed as the market turned around and flew higher.
Likewise after the dollar had gained as a ‘haven’ asset the prior week, it suddenly whipsawed dollar-bulls and turned drastically lower last week. The Dollar index (DXY) finished the week at its lowest in nearly 3 years.
Getting ‘whipsawed' isn't much fun! But it’s a fact of life in trading.
It also depends on the type of strategy you’re using. Breakout trades are particularly vulnerable because you’re entering at extreme levels, expecting the move to continue. A whipsaw is exactly when that continuation fails — the price pushes through a key level, looks like it’s breaking out, then quickly reverses and traps traders on the wrong side.
On the other hand, pullback strategies—or fading the top and bottom of a range—are built around the idea of trading against the prevailing move. And funny enough, that’s also what a whipsaw does. So while no strategy is immune, those that wait for price to stretch and revert can sometimes benefit from whipsaws, rather than fall victim to them.
And annoyingly - when it’s a market that creates a whipsaw- it tends to be a market that creates lots of whipsaws.
So just as the week before last tried to convince us there was a new dollar uptrend, and last week was looking more like a new dollar-downtrend - it could easily turn around again next week!
That’s why we will be assessing each currency pair based on its own merits. If there is a ‘clean’ setup we will use it. If there isn't, we won't consider it.
Setups and signals
We look at hundreds of charts each week and present you with three of our favourite setups and signals.
USD/CAD
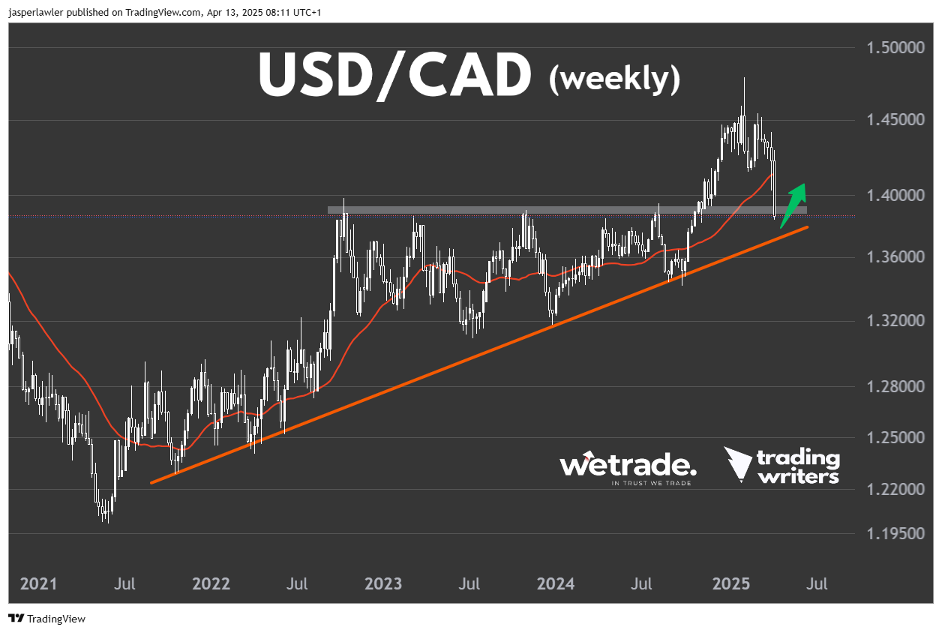
Long term chart (weekly)
Trend: Up
Phase: Large retracement, possible bearish reversal
Resistance: 1.45
Support: 1.385
Price action:
After a big breakout over the 1.3850 resistance in H2 last year, USD/CAD reversed from long term resistance at 1.47 and has slumped all the way back again to 1.3850, which is now possible support. Just below is the long term uptrend line.
View: Neutral
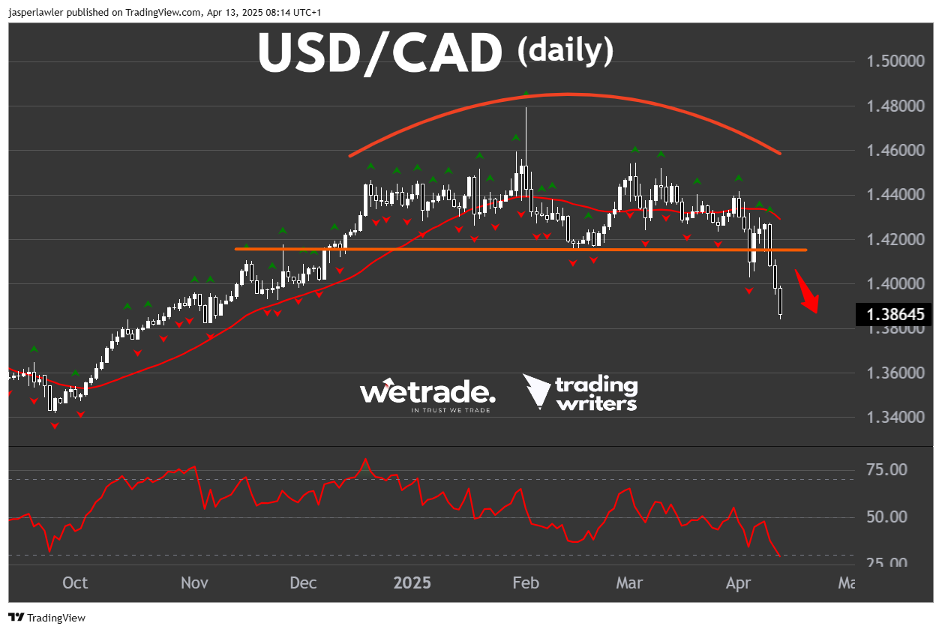
Medium term chart (daily)
Trend: Down
Phase: Breakdown from H&S pattern
Resistance: 1.415
Support: 1.34
Price action:
The daily chart shows a completed Head and Shoulders pattern, with a neckline at 1.415. We will be looking for possible short setups on rebounds towards the neckline, while eventually looking for long setups near long term support and at the weekly uptrend line.
USD/SEK
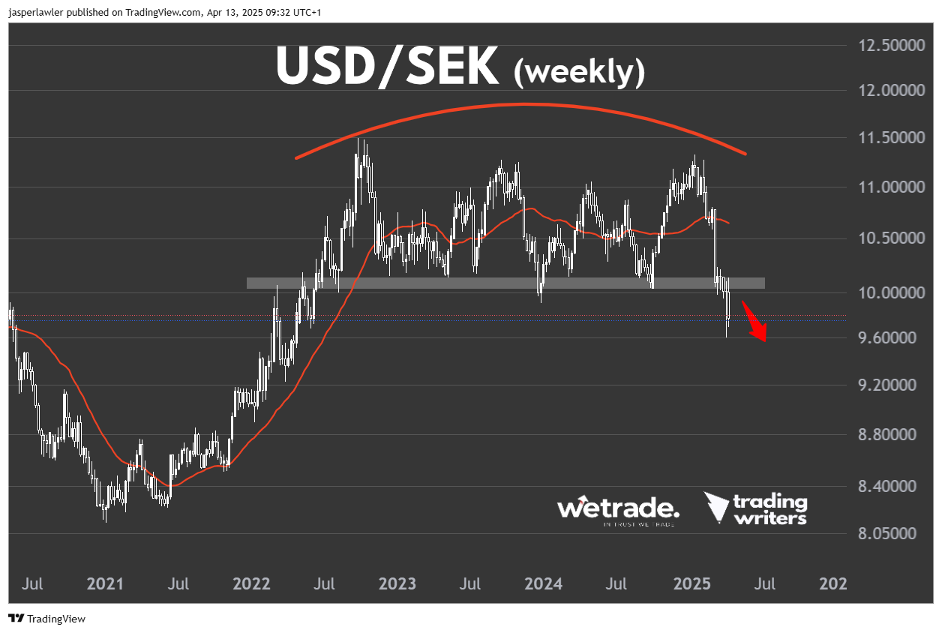
Long term chart (weekly)
Trend: Sideways
Phase: Completed top pattern
Resistance: 10.000
Support: 9.000
Price action:
The price has made a decisive break and weekly close below the long term neckline of a rectangle. We consider this a bearish sign that signals a new bear market. The long term objectives of this completed pattern could be as far as 8.500.
View: Bearish while below 10.000
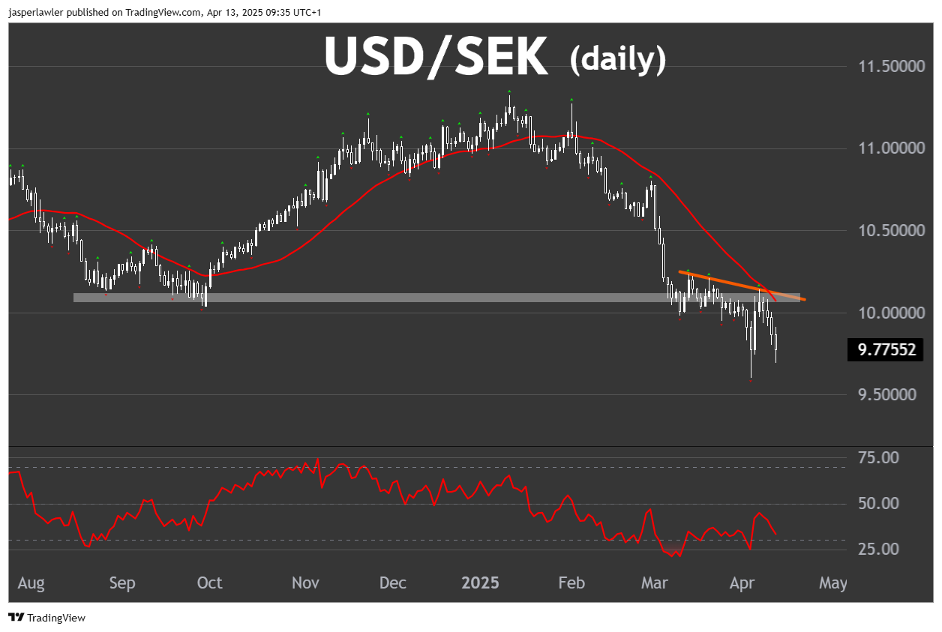
Medium term chart (daily)
Trend: Down.
Phase: First breakdown.
Resistance: 10.000
Support: 9.500
Price action:
The breakdown below- and successful re-test of horizontal support could see the height of the prior range as a downside objective, with 9.000 a natural target after 10.000 failed to hold.
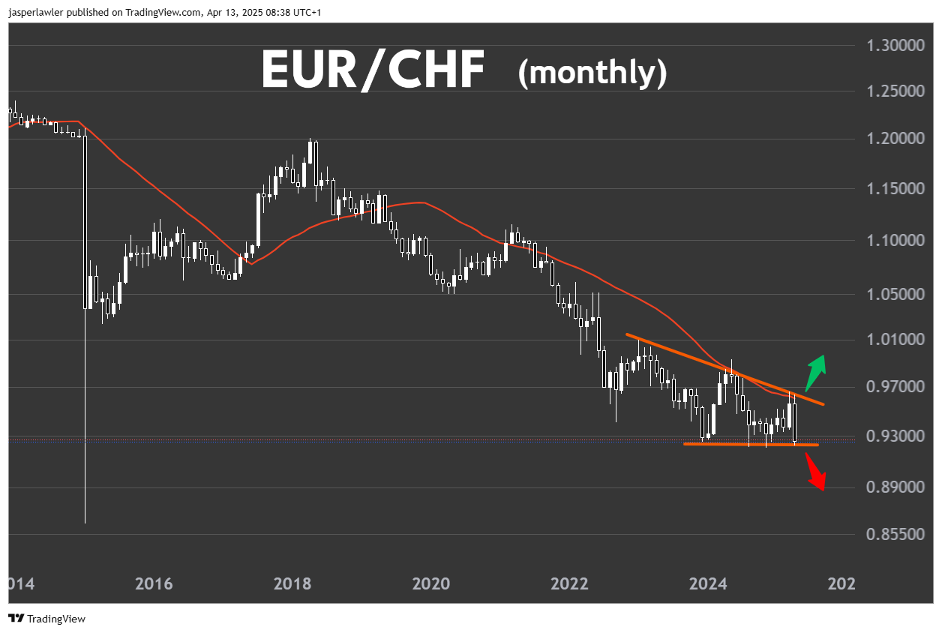
EUR/CHF
Long term chart (monthly)
Trend: Down
Phase: Triangle pattern
Resistance: 0.97
Support: 0.93
Price action:
Zooming out to a monthly chart, we can see the price is testing its lowest levels since the de-pegging in 2015. The bearish engulfing pattern from the triangle top and 30-month moving average suggests a break lower.
View: Bearish on a break below 0.93
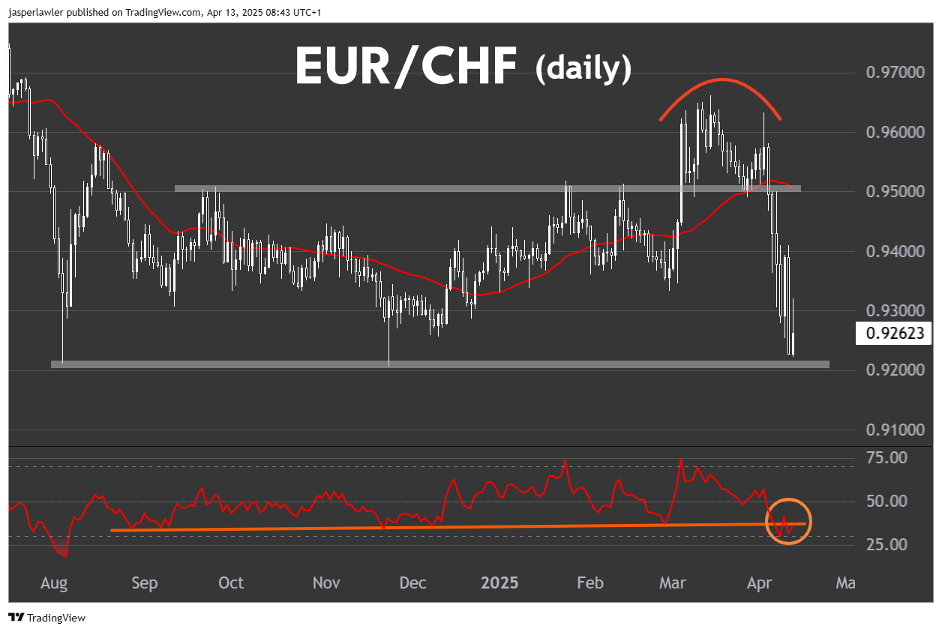
Medium term chart (daily)
Trend: Sideways
Phase: Testing range support
Resistance: 0.95
Support: 0.92
Price action:
Momentum as shown by RSI is the weakest since August last year. Following the fakeout over 0.96 and subsequent drop, we think a break lower is imminent.
Author

Jasper Lawler
Trading Writers
With 18 years of trading experience, Jasper began his career as a stockbroker on Wall Street in New York City before sharpening his analytical skills at top trading firms in the City of London.


